概要
matplotlibのsecondary_xaxis、secondary_yaxisを使い、グラフの任意の位置に複数の単位の軸を表示する方法を紹介します。
Google Colabで作成したコードは、こちらにあります。
注意
matplotlib.axes.Axes.secondary_xaxis、matplotlib.axes.Axes.secondary_yaxisは、matplotlibのversion3.1では、バグがある可能性があります。
バグの事例の1つに、https://github.com/matplotlib/matplotlib/issues/15621があります。
項目
1. x軸に別の軸を表示する例
上のx軸にはラジアンを、下のx軸には角度の単位としての度を表示する例を紹介します。
import matplotlib.pyplot as plt
import numpy as np

fig = plt.figure()
ax1 = fig.add_subplot(111)
x = np.arange(0, 360, 1)
y = np.sin(2 * x * np.pi / 180)
ax1.plot(x, y)
ax1.set_xlabel('angle [degrees]')
ax1.set_ylabel('signal')


def deg2rad(x):
    return x * np.pi / 180


def rad2deg(x):
    return x * 180 / np.pi


ax2 = ax1.secondary_xaxis('top', functions=(deg2rad, rad2deg))
ax2.set_xlabel('angle [rad]')
plt.show()
-
コードの説明
ax1.secondary_xaxis('top', functions=(deg2rad, rad2deg))で、軸の上(top)に軸を置き、ax1オブジェクトのx軸に用いた座標情報の配列をdeg2rad関数の引数に渡します。(deg2rad関数は、角度の度をラジアンに変換する関数です。)
そのdeg2rad関数の戻り値をrad2deg関数の引数に渡します。(rad2deg関数は、ラジアンを角度の度に変換する関数です。)
そのrad2degの戻り値をax1と同じ縮尺にします。そして、軸の上(top)の目盛に、deg2rad関数の値が表示されます。
つまり、基本的にfunctionsの2つ目の引数は、ax1オブジェクトのx軸と同じ単位にするための関数を置く使い方が良いと思います。 -
出力結果

2. y軸に別の軸を表示する例
左のy軸にはメートルを、右のy軸にはセンチメートルを表示する例を紹介します。
import matplotlib.pyplot as plt
import numpy as np

fig = plt.figure()
ax1 = fig.add_subplot(111)
x = np.arange(0, 360, 1)
y = np.sin(2 * x * np.pi / 180)
ax1.plot(x, y)
ax1.set_xlabel('angle [degrees]')
ax1.set_ylabel('signal [m]')


def m2cm(x):
    return x * 100


def cm2m(x):
    return x / 100


ax2 = ax1.secondary_yaxis('right', functions=(m2cm, cm2m))
ax2.set_ylabel('signal [cm]')
plt.show()
-
コードの説明
x軸に別の軸を表示する例と基本的に同じです。ax1.secondary_yaxisは、'right'で場所を指定しています。 -
出力結果

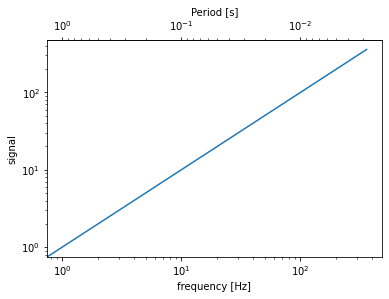
3. 対数軸を表示する例
上のx軸には周期を、下のx軸には周波数を対数軸で表示する例を紹介します。
import matplotlib.pyplot as plt
import numpy as np

fig = plt.figure()
ax1 = fig.add_subplot(111)
x = np.arange(0, 360, 1)
y = np.arange(0, 360, 1)
ax1.loglog(x, y)
ax1.set_xlabel('frequency [Hz]')
ax1.set_ylabel('signal')


def invert(x):
    # 1/x関数(0割対策でx=0のとき、1/x=infを返す)
    x = np.array(x).astype(float)
    near_zero = np.isclose(x, 0)
    x[near_zero] = np.inf
    x[~near_zero] = 1 / x[~near_zero]
    return x


ax2 = ax1.secondary_xaxis('top', functions=(invert, invert))
ax2.set_xlabel('Period [s]')
plt.show()
- コードの説明
ax1.loglog(x, y)で、x軸、y軸を対数軸にします。
ax1.secondary_xaxis('top', functions=(invert, invert))で、軸の上(top)に軸を置き、ax1オブジェクトのx軸に用いた座標情報の配列をinvert関数の引数に渡します。(invert関数は逆数を返す関数です。)
functionsの1つ目と2つ目の引数を同じinvert関数にすることで逆数の逆数となり、ax1オブジェクトのx軸と同じ単位にすることができます。
invert関数の中身は簡単な例で説明します。
x = np.array([0, 0.000000001, 1, 2, 3])が、どのように処理されるかを見ていきます。
near_zero = np.isclose(x, 0)で、近似的に0の値をTrue、それ以外はFalseを返します。
x[near_zero] = np.infで、Trueの配列にinf(無限)を入れます。
x[~near_zero] = 1 / x[~near_zero]で、Trueの配列に逆数を入れます。(~near_zeroは、配列のTrueとFalseを入れ替えるため、infではない配列が逆数を入れる対象となります。)
x = np.array([0, 0.000000001, 1, 2, 3])
x = np.array(x).astype(float)
near_zero = np.isclose(x, 0)
x[near_zero] = np.inf
x[~near_zero] = 1 / x[~near_zero]

print('near_zero=', near_zero)
print('~near_zero=', ~near_zero)
print('x =', x)
print('x[near_zero] =', x[near_zero])
print('x[~near_zero] =', x[~near_zero])

'''出力結果
near_zero= [True True False False False]
~near_zero= [False False True True True]
x = [inf inf 1. 0.5 0.33333333]
x[near_zero] = [inf inf]
x[~near_zero] = [1. 0.5 0.33333333]
'''
- 出力結果
4. 任意の位置に複数の単位の軸を表示する例
y軸にキロメートル、メートル、センチメートル、ミリメートルの単位の軸を表示する例を紹介します。
import matplotlib.pyplot as plt
import numpy as np

fig = plt.figure()
ax1 = fig.add_subplot(111)
x = np.arange(0, 360, 1)
y = np.sin(2 * x * np.pi / 180)
ax1.plot(x, y)
ax1.set_xlabel('angle [degrees]')
ax1.set_ylabel('signal [m]')

'''mとcmを変換する関数'''
def m2cm(x):
    return x * 100


def cm2m(x):
    return x / 100


'''mとmmを変換する関数'''
def m2mm(x):
    return x * 1000


def mm2m(x):
    return x / 1000


'''mとkmを変換する関数'''
def m2km(x):
    return x / 1000


def km2m(x):
    return x * 1000

# 2軸目
ax2 = ax1.secondary_yaxis('right', functions=(m2cm, cm2m))
ax2.set_ylabel('signal [cm]')

# 3軸目
ax3 = ax1.secondary_yaxis(1.2, functions=(m2mm, mm2m))
ax3.set_ylabel('signal [mm]')

# 4軸目
ax4 = ax1.secondary_yaxis(-0.2, functions=(m2km, km2m))
ax4.set_ylabel('signal [km]')

plt.show()
-
コードの説明
secondary_yaxisの1つ目引数は、数値も扱うことができ、数値で軸の場所を指定することができます。数値0がプロットエリアの左側(left)、1がプロットエリアの右側(right)となります。secondary_xaxisも同様に数値で軸の場所を指定でき、数値0がプロットエリアの下側(bottom)、1がプロットエリアの上側(top)となります。 -
出力結果

まとめ
グラフの任意の位置に複数の単位の軸を表示する方法を紹介しました。
使う機会は少ないと思いますが、誰かの役に立てれば幸いです。