概要
OpenCVとmatplotlibで画像の重心と慣性主軸をプロットする方法を紹介します。
画像の重心と慣性主軸の表示するのに関連する記事が少なかったため、備忘録も兼ねて記事にしました。
Google Colabで作成したコードは、こちらにあります。
重心と慣性主軸
画像の重心と慣性主軸は、画像のモーメントを使って表すことができます。画像のモーメントの定義については、cv::Moments Class Referenceを参照されたい。
画像の重心は、
x = \frac{m_{10}}{m_{00}},\ y = \frac{m_{01}}{m_{00}}
と表される。
画像の慣性主軸は、重心を通りその傾きを$\tan \theta$とすると
\begin{align}
\tan 2\theta &=2\frac{mu_{11}}{mu_{20}-mu_{02}}\\
\theta &= \frac{1}{2} \arctan \left(2\frac{mu_{11}}{mu_{20}-mu_{02}}\right)\\
\tan \theta &= \tan \left\{\frac{1}{2} \arctan \left(2\frac{mu_{11}}{mu_{20}-mu_{02}}\right) \right\}
\end{align}
と表される。ただし、$m_{**}$は空間モーメント、$mu_{**}$は中心モーメントを意味する。
手順
- 各種インポート
- サンプル画像、重心、慣性主軸の関数を用意
- グラフに表示
1. 各種インポート
各種インポート
import numpy as np
import matplotlib.pyplot as plt
import matplotlib.cm as cm
from scipy.stats import multivariate_normal
import cv2
実行時の各種バージョン
| Name | Version |
|---|---|
| numpy | 1.21.6 |
| matplotlib | 3.2.2 |
| scipy | 1.7.3 |
| opencv-python | 4.6.0.66 |
2. サンプル画像、重心、慣性主軸の関数を用意
サンプル画像
def get_sample_image():
    x, y = np.mgrid[-25:26:, -50:51:]
    pos = np.dstack((x, y))
    mean = np.array([0, 0])  # 分布の平均
    cov = np.array([[40, 40], [40, 180]])  # 分布の分散共分散行列
    rv = multivariate_normal(mean, cov)
    image = rv.pdf(pos)
    return image
重心
def get_gravity_coord(image):
    M = cv2.moments(image)
    gravity_x = int(M["m10"] / M["m00"])
    gravity_y = int(M["m01"] / M["m00"])
    return gravity_x, gravity_y
慣性主軸
def get_inertia_slope(image):
    M = cv2.moments(image)
    inertia_theta = 0.5*np.arctan2(2*M["mu11"], M["mu20"]-M["mu02"])
    inertia_slope = np.tan(inertia_theta)
    return inertia_slope
3. グラフに表示
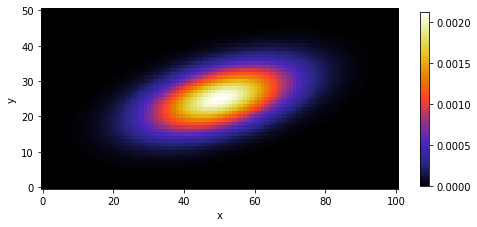
サンプル画像の確認
サンプル画像の確認
image = get_sample_image()
fig, ax = plt.subplots(1, 1, figsize=(8, 4))
cbar = ax.imshow(image, cmap=cm.CMRmap, origin="lower")
ax.set_xlabel("x")
ax.set_ylabel("y")
fig.colorbar(cbar, shrink=0.8)
plt.show()
出力結果
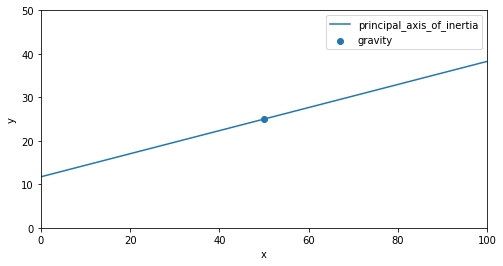
重心と完成主軸をグラフに表示
重心と完成主軸をグラフに表示
gravity_x, gravity_y = get_gravity_coord(image)
inertia_slope = get_inertia_slope(image)
x = np.arange(101)
y = inertia_slope*(x-gravity_x) + gravity_y  # 傾きから直線をプロット

fig, ax = plt.subplots(1, 1, figsize=(8, 4))
ax.scatter(gravity_x, gravity_y, label="gravity")
ax.plot(x, y, label="principal_axis_of_inertia")
ax.set_xlabel("x")
ax.set_ylabel("y")
ax.set_xlim(0, 100)
ax.set_ylim(0, 50)
ax.legend()
plt.show()
出力結果
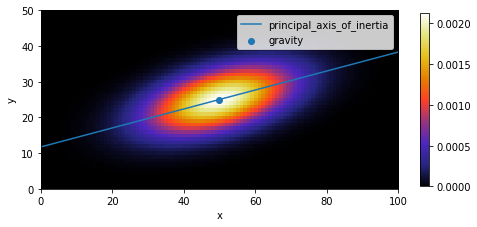
重心と慣性主軸を画像に重ねて表示
重心と慣性主軸を画像に重ねて表示
fig, ax = plt.subplots(1, 1, figsize=(8, 4))
cbar = ax.imshow(image, cmap=cm.CMRmap, origin="lower")
ax.scatter(gravity_x, gravity_y, label="gravity")
ax.plot(x, y, label="principal_axis_of_inertia")
ax.set_xlabel("x")
ax.set_ylabel("y")
ax.set_xlim(0, 100)
ax.set_ylim(0, 50)
fig.colorbar(cbar, shrink=0.8)
ax.legend()
plt.show()
出力結果
まとめ
OpenCVとmatplotlibで画像の重心と慣性主軸をプロットする方法を紹介しました。誰かの役に立てれば幸いです。