はじめに
デコンボリューション法は、ぼやけた画像を元の鮮明な状態に復元するための重要な手法です。特に天文学の分野では、観測装置による画像の劣化を補正するためにRichardson-Lucyデコンボリューション(以下、RL法)が広く用いられています。この手法では、点拡がり関数(Point Spread Function, PSF)を使って、観測時にぼやけた天体画像を高精度で復元することが可能です。
しかし、RL法には大きな課題があります。反復回数を大きくしすぎると、画像のノイズが過剰に強調され推定画像が劣化します。そのため、適切な反復回数の見極めが非常に重要です。本記事では、この問題に対処するために、カイ二乗値の変化率を用いて収束を判断する方法を紹介し、その実装例を示します。この方法は、Marchenko et al. (2019) の研究に基づいています。
本記事の実装コードは、こちらからも閲覧できます。
また、RL法の基本的な説明は次の記事をご覧いただければと思います。
判定方法
RL法の反復回数を決定するために、Reduced Chi-Squared($\chi^2_{\text{red}}$)の変化率を基準とします。各反復で観測画像と復元画像を比較し、その差をカイ二乗値として定量化します。カイ二乗値の変化率が一定の閾値を下回った時点で収束と見なし、適切な反復回数を決定します。
観測画像のノイズはポアソン分布に従うことを前提としていますが、ここでは反復回数$r$回目のReduced Chi-Squaredを$\chi^{2,(r)}_{\text{red}}$とし、ガウス分布の近似を使って以下の式で定義します。
\chi^{2,(r)}_{\text{red}} = \frac{1}{D} \sum_i \frac{\left[N_i - (W^{(r)} \ast P)_i\right]^2}{\sigma_i^2}
ここで、$N_i$ は観測画像のピクセル$i$におけるカウント値、$W^{(r)}$ はRL法の$r$回目の反復結果、$P$ はPSFです。$D$は自由度を表し、$\ast$は畳み込み演算を意味します。$W^{(r)} \ast P$ は推定画像にPSFを適用したシミュレーション画像(ぼやけた画像)です。
カウント値の標準偏差 $\sigma_i$ は、次のように定義されます。
\sigma_i =
\begin{cases}
\sqrt{N_i} & (N_i \geq 5) \\
1 + \sqrt{N_i + 0.75} & (N_i < 5)
\end{cases}
カウント数が少ない場合は、ポアソンノイズの影響を強く受けるため、Gehrels (1986) による補正式を用います。
$\chi^{2,(r)}_{\text{red}}$の変化率の絶対値は、次のように定義されます。
\delta \chi^{2,(r)}_{\text{red}} = \frac{|\chi^{2,(r)}_{\text{red}} - \chi^{2,(r -1)}_{\text{red}}|}{\chi^{2,(r)}_{\text{red}}}
ここで、$\delta \chi^{2,(r)}_{\text{red}}$ は、反復 $r-1$ から次の反復 $r$ における変化率を示します。これにより、Reduced Chi-Squared の収束度合いを定量的に評価できます。
実装する際は、評価範囲に注意することが重要です。天体像以外の外側の暗い領域(背景領域)を含めると、これらの領域における微小な変動が収束判定に大きく影響を与える可能性があるため、評価対象から除外する方が良いかもしれません。また、画像の周縁部ではPSFの畳み込みによる計算誤差が顕著に現れるため、この部分も評価から除外することが適切な結果を得るために重要だと思います。
シミュレーションの実装
観測画像の生成とRL法の実装
まず、RL法を適用する前に、シミュレーション用の観測画像を生成します。以下の手順に従って、ガウスPSFを使用してぼやけた画像を作成し、RL法による復元処理を実行します。
import numpy as np
import matplotlib.pyplot as plt
from scipy.ndimage import gaussian_filter
from scipy.signal import convolve

# ガウスPSFを生成
psf_size = 25
psf_sigma = 4
psf = np.zeros((psf_size, psf_size))
psf[psf_size // 2, psf_size // 2] = 1
psf = gaussian_filter(psf, sigma=psf_sigma)
psf /= psf.sum()

# 拡散放射と点源を持つ合成画像を生成
image_size = 126
intensity = np.zeros((image_size, image_size))

# 拡散放射を追加 (銀河や星雲を模倣)
x = np.linspace(-1, 1, image_size)
y = np.linspace(-1, 1, image_size)
xv, yv = np.meshgrid(x, y)
diffuse_emission = np.exp(-(xv**2 + yv**2) / 0.1)
intensity += diffuse_emission * 100

# 明るさの異なる点源をランダムに追加
np.random.seed(10)
brightness_levels = [10000, 5000, 1000]
num_sources_per_level = [6, 20, 100]

for brightness, num_sources in zip(brightness_levels, num_sources_per_level):
    for _ in range(num_sources):
        x_pos = np.random.randint(36, image_size - 36)
        y_pos = np.random.randint(36, image_size - 36)
        intensity[y_pos, x_pos] = brightness

# ポアソン分布に従う画像を生成
image = np.random.poisson(intensity)

# ぼかされた画像を生成
blurred_image = convolve(image, psf, mode='same')
blurred_image[blurred_image < 0] = 0

# 擬似観測画像を生成 (Poissonノイズ付き)
exposure_time = 1
blurred_image_exposure = blurred_image * exposure_time
observed_image = np.random.poisson(blurred_image_exposure)

# RLデコンボリューションを適用
def each_iter_richardson_lucy(image, psf, iterations=50):
    float_type = np.promote_types(image.dtype, np.float32)
    image = image.astype(float_type, copy=False)
    psf = psf.astype(float_type, copy=False)

    deconv_image = np.full(image.shape, 0.5, dtype=float_type)
    psf_mirror = np.flip(psf)
    for _ in range(iterations):
        blurred = convolve(deconv_image, psf, mode="same") + 1e-14
        relative_blur = image / blurred
        deconv_image *= convolve(relative_blur, psf_mirror, mode="same")
    return deconv_image

rl_image = each_iter_richardson_lucy(observed_image, psf, iterations=50)

# 結果をプロット
fig, ax = plt.subplots(1, 4, figsize=(20, 5))

ax[0].imshow(image, cmap='gray', origin='lower')
ax[0].set_title(f'True Image')

ax[1].imshow(blurred_image, cmap='gray', origin='lower')
ax[1].set_title('Blurred Image')

ax[2].imshow(observed_image, cmap='gray', origin='lower')
ax[2].set_title(f'Observed Image (Exposure Time: {exposure_time})')

ax[3].imshow(rl_image, cmap='gray', origin='lower')
ax[3].set_title('Restored Image after 50 RL Iterations')

plt.tight_layout()
plt.show()
コードの説明
1. ガウスPSFの生成
天体観測におけるぼやけを再現するため、ガウス関数に基づいたPSFを生成します。これにより、観測装置によるぼやけ効果をシミュレートします。
2. 合成天体画像の作成
拡散放射(銀河や星雲を模倣)と、ランダムに配置した点源(星)を組み合わせた合成画像を作成します。これにより、現実の天体画像に近いシミュレーションデータを生成します。
3. 観測画像の生成
合成画像にPSFを適用してぼやけた画像を生成し、ポアソンノイズを加えて観測画像をシミュレートします。
4. RLデコンボリューションの適用
RL法を適用し、観測画像から50回の反復で復元画像を得ます。
5. 結果の表示
最後に、シミュレーションの結果を以下の4つの画像として表示します。
- True Image: 元の合成画像(真の画像)
- Blurred Image: PSFによってぼやけた画像
- Observed Image: Poissonノイズを加えた観測画像
- Restored Image: 50回のRL法反復後に復元された画像
収束判定の導入
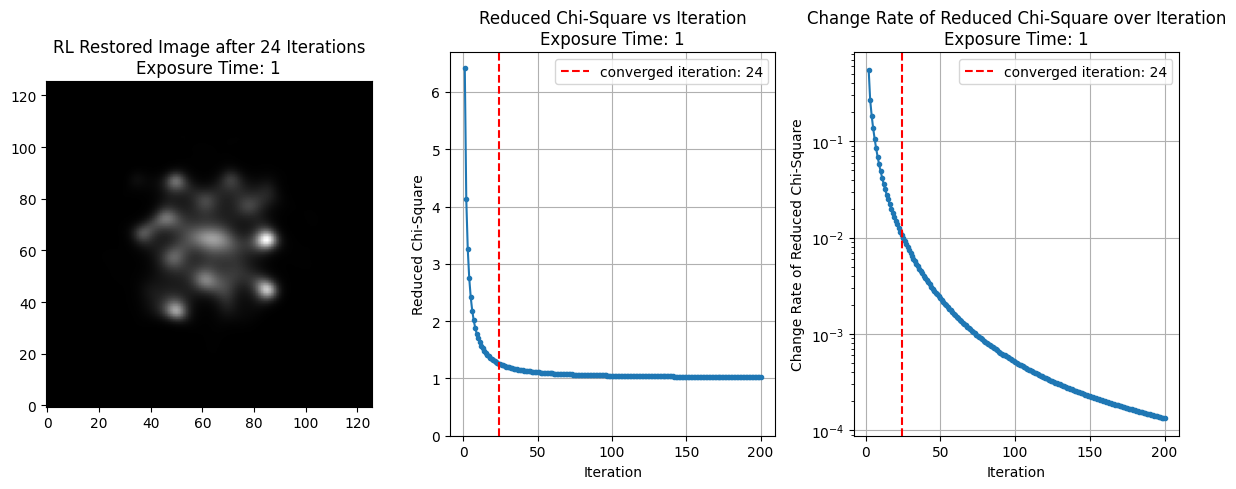
RL法において、反復回数の増加に伴うカイ二乗値の変化率を計算し、それが一定の閾値を下回った時点で収束と判断します。これにより、適切な反復回数を決定し、過剰な反復によるノイズの強調を防ぐことができます。
この記事では先に示した$\delta\chi^2_{\text{red}}$を基準に収束判定を行います。カイ二乗値の変化率が一定の閾値を下回った時点で収束と見なします。
import numpy as np
import matplotlib.pyplot as plt
from scipy.ndimage import gaussian_filter
from scipy.signal import convolve

# Richardson-Lucy反復処理を行う関数
def each_iter_richardson_lucy(image, psf, iterations=50):
    float_type = np.promote_types(image.dtype, np.float32)
    image = image.astype(float_type, copy=False)
    psf = psf.astype(float_type, copy=False)

    deconv_image = np.full(image.shape, 0.5, dtype=float_type)
    psf_mirror = np.flip(psf)
    deconv_images = np.empty([iterations+1, *image.shape], dtype=float_type)
    deconv_images[0] = image

    for i in range(1, iterations+1):
        blurred = convolve(deconv_image, psf, mode="same") + 1e-14
        relative_blur = image / blurred
        deconv_image *= convolve(relative_blur, psf_mirror, mode="same")
        deconv_images[i] = deconv_image.copy()

    return deconv_images

# 観測値とシミュレーション結果のカイ二乗値を計算する関数
def calc_chi(rl_image, psf, observed_image, crop_x=30, crop_y=30):
    shape_y, shape_x = rl_image.shape
    simulated_image = convolve(rl_image, psf, mode='same')

    center_region = (slice(shape_y//2-crop_y, shape_y//2+crop_y),
                     slice(shape_x//2-crop_x, shape_x//2+crop_x))
    simulated_image = simulated_image[center_region]
    observed_image = observed_image[center_region]
    dof = np.size(observed_image) - 1

    sigma = np.where(observed_image < 5, 1 + np.sqrt(observed_image + 0.75), np.sqrt(observed_image))

    chi = (simulated_image - observed_image) ** 2 / sigma ** 2
    reduced_chi = np.sum(chi) / dof

    return reduced_chi

# 拡散放射と点源を持つ合成画像を生成
image_size = 126
intensity = np.zeros((image_size, image_size))

# 拡散放射を追加 (銀河や星雲を模倣)
x = np.linspace(-1, 1, image_size)
y = np.linspace(-1, 1, image_size)
xv, yv = np.meshgrid(x, y)
diffuse_emission = np.exp(-(xv**2 + yv**2) / 0.1)
intensity += diffuse_emission * 100

# 明るさの異なる点源をランダムに追加
np.random.seed(10)
brightness_levels = [10000, 5000, 1000]
num_sources_per_level = [6, 20, 100]

for brightness, num_sources in zip(brightness_levels, num_sources_per_level):
    for _ in range(num_sources):
        x_pos = np.random.randint(36, image_size - 36)
        y_pos = np.random.randint(36, image_size - 36)
        intensity[y_pos, x_pos] = brightness

# ポアソン分布に従う画像を生成
image = np.random.poisson(intensity)

# ガウスPSFを生成
psf_size = 25
psf_sigma = 4
psf = np.zeros((psf_size, psf_size))
psf[psf_size // 2, psf_size // 2] = 1
psf = gaussian_filter(psf, sigma=psf_sigma)
psf /= psf.sum()

# 露光時間
exposure_time = 1

# 各露光時間でRLデコンボリューションを適用し結果を表示
fig, ax = plt.subplots(1, 3, figsize=(12, 5))

# 画像をぼかす
blurred_image = convolve(image, psf, mode='same')
blurred_image[blurred_image < 0] = 0

# 擬似観測画像を生成 (Poissonノイズ付き)
blurred_image_exposure = blurred_image * exposure_time
observed_image = np.random.poisson(blurred_image_exposure)

# Richardson-Lucyデコンボリューションを適用
iterations = 200
rl_images = each_iter_richardson_lucy(observed_image, psf, iterations)

# カイ二乗値を計算
chi_values = [calc_chi(rl_images[j], psf, observed_image) for j in range(iterations+1)]

# カイ二乗値の変化率を計算
chi_change_rate = np.abs(np.diff(chi_values)) / chi_values[1:]

# -chi_change_rate < 1e-2 となる最初の反復回数を取得
converg_threshold = 1e-2
converg_iter = next((idx for idx, val in enumerate(chi_change_rate) if val < converg_threshold), None)

# プロット
ax[0].imshow(rl_images[converg_iter], cmap='gray', origin='lower')
ax[0].set_title(f'RL Restored Image after {converg_iter} Iterations\nExposure Time: {exposure_time}')
ax[1].plot(range(1, iterations+1), chi_values[1:], marker='.')
ax[1].set_ylim(0,)
ax[1].set_xlabel('Iteration')
ax[1].set_ylabel('Reduced Chi-Square')
ax[1].set_title(f'Reduced Chi-Square vs Iteration\nExposure Time: {exposure_time}')
ax[1].grid(True)

ax[2].plot(range(2, iterations+1), chi_change_rate[1:], marker='.')
ax[2].set_xlabel('Iteration')
ax[2].set_ylabel('Change Rate of Reduced Chi-Square')
ax[2].set_title(f'Change Rate of Reduced Chi-Square over Iteration\nExposure Time: {exposure_time}')
ax[2].set_yscale('log')
ax[2].grid(True)

# 閾値以下の反復回数に縦線を追加
if converg_iter is not None:
    ax[1].axvline(converg_iter, color='red', linestyle='--', label=f'converged iteration: {converg_iter}')
    ax[1].legend()
    ax[2].axvline(converg_iter, color='red', linestyle='--', label=f'converged iteration: {converg_iter}')
    ax[2].legend()

plt.tight_layout()
plt.show()
コードの説明
1. カイ二乗値の計算
各反復結果について、観測画像と復元画像を比較し、カイ二乗値を計算します。これを自由度で割ることで$\chi^2_{\text{red}}$を求め、$\chi^2_{\text{red}}$が1に近いほどモデルが観測データに良く一致していると判断します。ただし、低カウント領域やカウントゼロのピクセルはカイ二乗値を過大評価する可能性があるため、評価領域を制限し注意深く分析する必要があります。
2. カイ二乗値の変化率による収束判定
反復ごとの$\chi^2_{\text{red}}$の変化率を計算し、その値が設定した閾値($10^{-2}$)を下回った時点で収束と判断します。これにより、適切な反復回数を見極め、過剰な反復によるノイズの強調を防ぎます。
3. 結果の可視化
RL法を200回の反復にわたって適用し、以下の3つのグラフを表示しています。
- 復元画像: 収束判定された反復回数後の復元画像
- カイ二乗値の推移: 反復回数ごとの$\chi^2_{\text{red}}$の変化
- カイ二乗値の変化率: $\chi^2_{\text{red}}$の変化率をログスケールで表示
また、カイ二乗値の変化率が閾値を下回った反復回数に対応する箇所には赤い縦線を追加し、収束のタイミングを視覚的に示しています。
補足: 収束基準と露光時間の影響
露光時間は、観測画像に含まれるノイズの量に大きく影響します。露光時間が短い場合、ノイズが多くなり、復元精度に悪影響を与えることがあります。一方、露光時間が長い場合、観測画像はより多くの光子を捉え、ノイズが少なくなります。
ここでは、以下の手順でRLデコンボリューションを実行し、異なる露光時間での収束回数と復元画像を比較します。
以下の図は、露光時間を 0.1, 1, 10, 100, 1000 に変化させた際の最適な反復回数後のRL法による復元画像を示しています。
この図から、露光時間が長くなるほど、カイ二乗値の変化率が $10^{-2}$ を下回るまでの反復回数が増えることがわかります。これにより、露光時間が長い場合、ノイズの増幅を抑えつつより細かい構造まで復元できる可能性があると解釈できます。
まとめ
本記事では、Richardson-Lucyデコンボリューション(RL法)の反復回数を適切に見極めるため、カイ二乗値の変化率を用いた収束判定方法を紹介しました。この方法を活用することで、過剰な反復によるノイズの増幅を避けつつ、効率的に画像を復元できることが確認されました。
本記事で紹介した方法が反復回数の指標として活用されることを願っています。
参考文献
- Marchenko, V., Harris, D. E., Ostrowski, M., et al. 2017, ApJ, 844, 11, doi: 10.3847/1538-4357/aa755d
- Gehrels, N. 1986, ApJ, 303, 336, doi: 10.1086/164079


