これまで、ログ等の時系列データをElasticsearchに取り込む場合は、Beats系 (ログの場合はFilebeat) やLogstashが主流でしたが、しばらく前にElastic AgentがGAになって、データの取り込みがより簡単になってきています。
今回は、Elastic Agent に焦点を当てて、実際に時系列のデータを取り込んでみましょう。
記事の情報は8.2をベースにしています。
Elastic Agentとは?
ひとことで言うと、データ収集のための単一の統合エージェントということになるのですが、乱暴な言い方をすると、これまでの各種Beat (Filebeat, Metricbeat, などなど) や、Endpoint Securityもひとまとめにして、設定や管理を簡単にしたもの、と言えるかと思います。よく「Beatsを置き換えるものですか?」と聞かれるんですが、答えはYesでもNoでもあります。
どう言う意味かと言うと、Elastic Agent自体は、ある意味コントロールプレーンのようなものであって、設定やインストール、バージョンアップを制御するものです。データプレーンとしての役割、つまり実際にデータ (ログやメトリック) を転送するデータシッパーの機能は、内部的には、依然として各種のBeatが担っています。例えば、実際にPCにElastic Agentをインストールして、設定をして起動すると、子プロセスとしてFilebeatやMetricbeatが動きます。では、わざわざコントロールプレーンを導入したメリットはというと、Fleetという機能を使って、KibanaからElastic Agentの構成管理をUIから一元的に行うことができることです。
Elastic Agent Integrationsって何?
Elastic Agentを使って様々な製品のログやメトリックを取得しようとする場合、既に対応済みのコネクター的なものが用意されています。Elastic Integrations というのですが、このネーミングがややこしいです。日本語にすると「統合」ですから、そのままじゃん!と。Elastic Integrationsというと、幅広くコネクター的なもの全般を指していて、Workplace Searchのコネクターやら、APMエージェントなんかも含んでしまうので、ここでは対象を絞って、Elastic Agent Integrations の話です (ややこしい...)。
Beats Moduleのようなもの?
ご存知の方もいると思いますが、Beats系でコネクター的なものを指す時には、Filebeat Modules や Metricbeat Modules がありました。Elastic Agent Integrationは、早い話が、Elastic Agent界でのBeats Modulesです。かなりの数のBeats Modulesが既に移植されており、新規モノはElastic Agent Integrationsだけ、というパターンもあるので、状況は 公式ドキュメント を参照してみてください。
Elastic Agent Integrationsの中身
ここでは、Nginx Integrationを例に取ってちょっと中を見てみたいと思います。Kibanaの Integrations > Browse integrations からNginx Integrationをブラウズしてみると、以下のように表示されます。
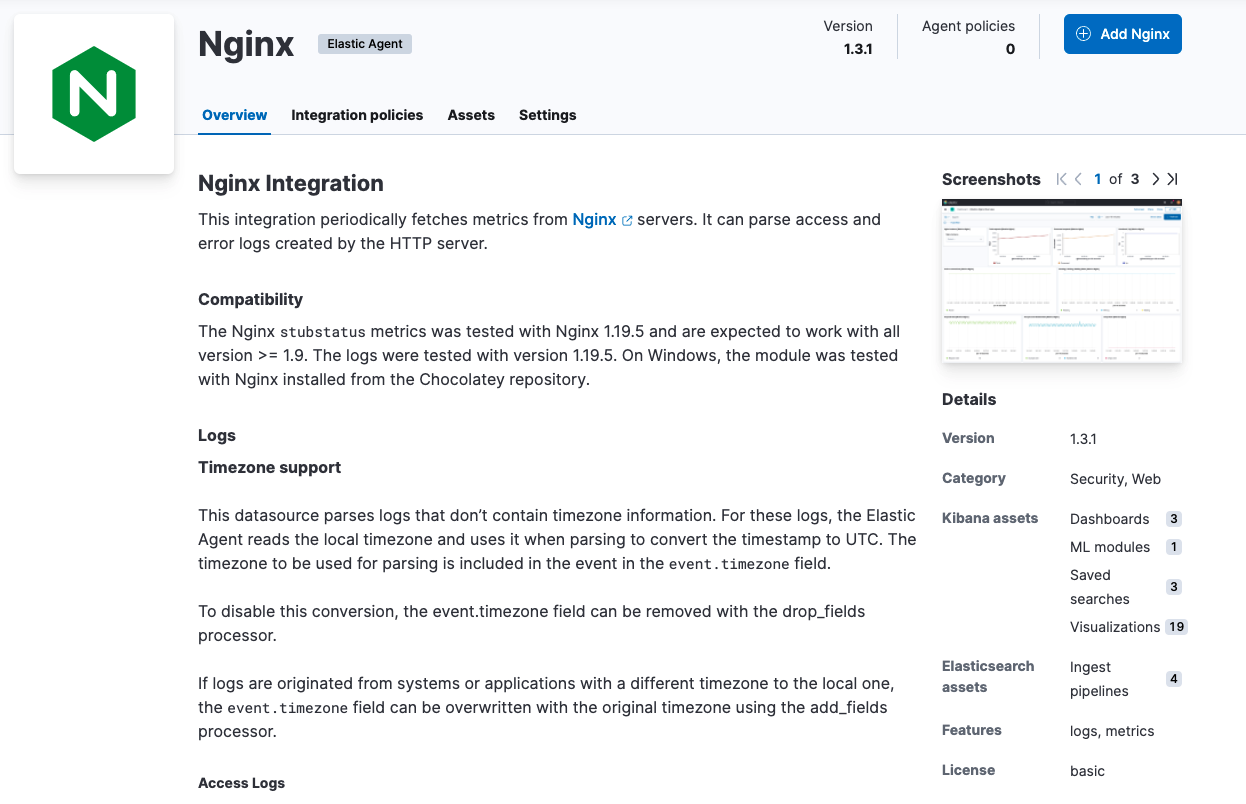
右側のDetails下のKibana assetsというのは、Kibanaのオブジェクトのことで、Dashoardの定義やVisualization、ML Jobの定義などが含まれます。Elasticsearch assetsというのは、Ingest Pipelines ですね。この辺りは、Beats Modulesと同じです。
実際に、Integrationを追加する時には、以下のような構成画面で設定を促されるのですが、内部的には、Collect... それぞれがElasticsearchの Datastream に対応します。Elastic Agentでは、データの投入先が、従来のIndexからDatastreamになっていることが、これまでの(7系までの)Beats Modulesとの違いの一つです。

GitHubのElastic Integrationsレポ にある、Nginx Integration の access logのDatastreamの定義ファイル を見てみるとわかりますが、inputとして、logfileとhttpjsonの2つが定義されています。これは、Filebeatの Log input と HTTP JSON input に対応します。
title: Nginx access logs
type: logs
streams:
  - input: logfile
    vars:
      - name: paths
        type: text
        title: Paths
        multi: true
        required: true
        show_user: true
        default:
          - /var/log/nginx/access.log*
      - name: tags
        type: text
        title: Tags

   (中略)

  - input: httpjson
    title: Nginx access logs via Splunk Enterprise REST API
    description: Collect Nginx access logs via Splunk Enterprise REST API
    enabled: false
    template_path: httpjson.yml.hbs
    vars:
      - name: interval
        type: text
        title: Interval to query Splunk Enterprise REST API
        description: Go Duration syntax (eg. 10s)
        show_user: true
        required: true
        default: 10s

   (後略)
興味があれば他のIntegrationも見てみると面白いのですが、ざっくり言うと、Integrationは Package という単位で管理され、それぞれ以下のもので構成されています。
- Packageの定義 (manifest.yml)
- Kibanaのオブジェクト (kibana folder)
- Datasteramの定義 (data_stream folder)
- Beats inputの定義の素 (Data stream manifest)
- Beatsの設定テンプレート (agent/stream)
- Field Mappingの定義 (fields folder)
- Ingest Pipelineの定義 (elasticsearc/ingest_pipeline)
実際にやってみよう
さて、前置きはこれくらいにして、実際にElastic Agent Integationsを構成してみましょう。Integrationsが対応済みの様々なデータソースについては、UIのガイドに従ってポチポチ設定していくだけなので、ここでは、カスタムなデータ形式をどのようにしてElastic Agentで扱っていくか、を見ていきます。
1. NewsAPI
今回は、NewsAPIという、世の中のニュースのヘッドラインをJSON形式で返してくれるAPIをデータソースとして使ってみます。Developer Subscriptionなら無償で使えるようですので、登録してAPI Keyを取得します。パラメータによって、対象を絞り込むことができるのですが、Japanのヘッドラインを取得するとこんな感じで返ってきます。
GET https://newsapi.org/v2/top-headlines?country=jp&apiKey=hogehoge
レスポンス:
{
  "status": "ok",
  "totalResults": 29,
  "articles": [
    {
        "source": {
          "id": null,
          "name": "News.local"
        },
        "author": "ローカルニュース",
        "title": "これはニュースだ!",
        "description": "今日、なんとも嬉しい出来事がありました!",
        "url": "https://news.local/hogehoge.html",
        "urlToImage": "https://news.local/hogehoge/hogehoge.jpg",
        "publishedAt": "2022-04-28T02:02:00Z",
        "content": null
    },
    {
      (中略)
    }
  ]
}
2. Integrationの設定
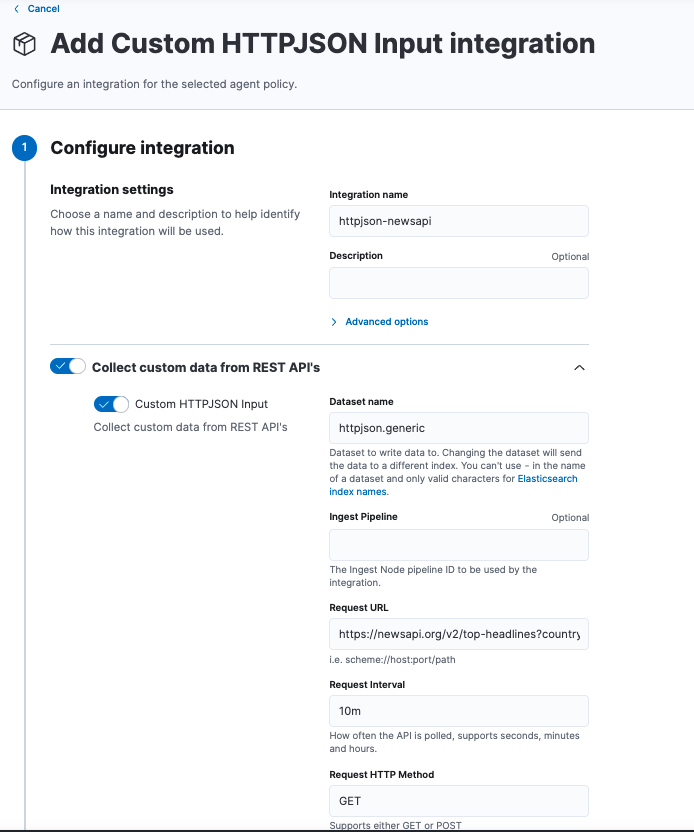
Kibanaの Integrations > Browse integrations から追加したいIntegrationをクリックします。一般的なカスタムログなんかですと、Custom Logs を使うのが一般的ですが、ここはデータソースがAPIですので、Custom HTTPJSON Input を追加します。Integration nameにhttpjson-newsapiと入力し、Request URLにはNewsAPIのURLを設定し、Request Intervalはここでは10mと入力しておきます。
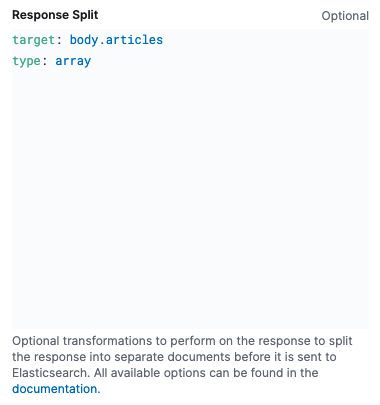
先ほどのNewsAPIから返されるJSONドキュメントを見てみると、必要なデータは、articles配列の要素であることがわかります。そこで、Response Split の機能を使って、配列の要素毎にイベントを生成するようにします。スクロールダウンして、以下のように入力します。これで、前述の例のように29のニューストピックスが配列として返された場合は、29の独立したイベントが生成されるようになります。
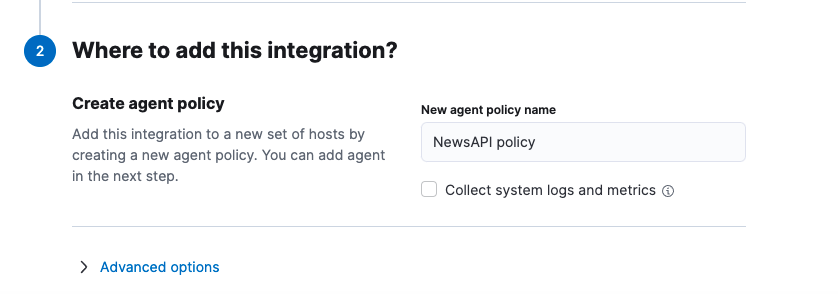
Integrationを追加する時には、必ずAgent Policyに対して紐づける必要があります。ここでは、Policy nameをNewsAPI policyとして、新規のAgent Policyを作成します。Collect system logs and metricsをチェックすると、このPolicyが割り当てられたElastic AgentのマシンのSystem logsやmetricsまで収集されるので、ここではチェックを外しておきます。
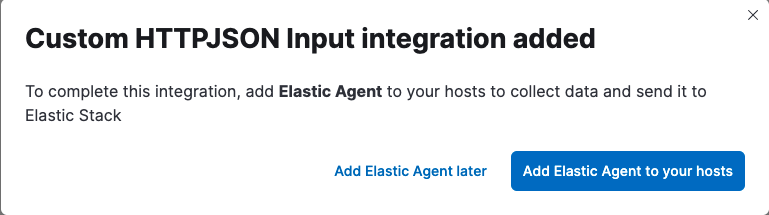
これで保存すると、次のようなポップアップが出力されますので、Add Elastic Agent to your hostsをクリックして、Elastic Agentをインストールします。Add Elastic Agent laterをクリックした場合は、Kibanaの Fleet から Add agentで再開することも可能です。
Elastic AgentのインストールはどのマシンでもOKですが、私の場合は自分のMacにインストールしました。インストール自体は、UIのガイドに従ってやれば簡単です。

Elastic Agentのインストールが完了して、エンロールされると、Fleet > Agents から、今インストールしたElastic Agentが確認できます。
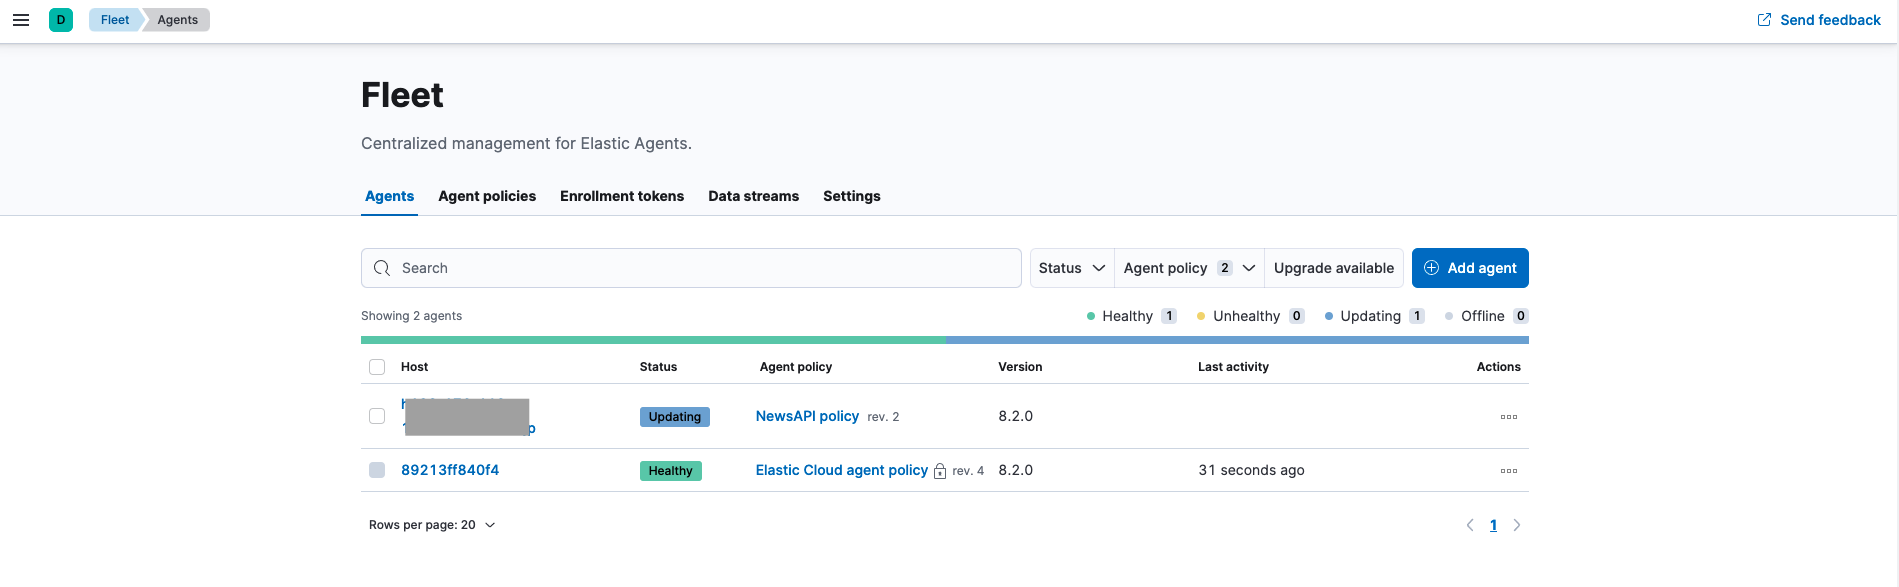
この辺りの、Integration、Agent Policy、Agentの関係性が多段になっていて、ちょっとわかりにくいのですが、イメージとしてはこんな感じです(論理的には)。

- 1つのAgent Policyに複数のIntegrationを紐づける
- IntegrationはAgent Policyがないとインストールできない
- 1つのAgent Policyを複数のElastic Agentに割り当てる
この段階で、ElasticsearchにIndexされたイベント(ドキュメント)は、以下のようになります。
{
  "_index": ".ds-logs-httpjson.generic-default-2022.05.09-000001",
  "_id": "ZGM0p4ABTkIxlzSI8opI",
  "_version": 1,
  "_score": 1,
  "_source": {
    "agent": {
      "name": "hogehoge.local",
      "id": "ae90094c-cce4-4c70-97e6-3b09bf6f28cc",
      "type": "filebeat",
      "ephemeral_id": "bb662f9a-fa60-4f67-9a2d-23b9eb04f6ed",
      "version": "8.2.0"
    },
    "elastic_agent": {
      "id": "ae90094c-cce4-4c70-97e6-3b09bf6f28cc",
      "version": "8.2.0",
      "snapshot": false
    },
    "message": "{\"author\":\"ローカルニュース\",\"content\":null,\"description\":\"今日、なんとも嬉しい出来事がありました!\",\"publishedAt\":\"2022-05-08T21:38:15Z\",\"source\":{\"id\":null,\"name\":\"News.local\"},\"title\":\"これはニュースだ!",\"url\":\"https://news.local/hogehoge.html\",\"urlToImage\":\"https://news.local/hogehoge/hogehoge.jpg\"}",
    "tags": [
      "forwarded"
    ],
    "input": {
      "type": "httpjson"
    },
    "@timestamp": "2022-05-09T05:05:05.470Z",
    "ecs": {
      "version": "8.0.0"
    },
    "data_stream": {
      "namespace": "default",
      "type": "logs",
      "dataset": "httpjson.generic"
    },
    "event": {
      "agent_id_status": "verified",
      "ingested": "2022-05-09T05:05:06Z",
      "created": "2022-05-09T05:05:05.470Z",
      "dataset": "httpjson.generic"
    }
  }
}
3. JSON文字列をデコードする
この状態ですと、messageフィールドに先のNewsAPIで取得したarticlesの要素が、全てJSON文字列として格納されていてイマイチよくわかりません。ということで、ElasitcsearchのIngest Pipelineを使って、このJSON文字列をデコードしましょう。Ingest Pipelineは Kibanaの Stack Management > Ingest Pipelines からも簡単に作成できます。
JSON processor を使って、newsapiというIngest Pipelineを作成します。
PUT _ingest/pipeline/newsapi
{
  "processors": [
    {
      "json": {
        "field": "message",
        "ignore_failure": true
      }
    }
  ]
}
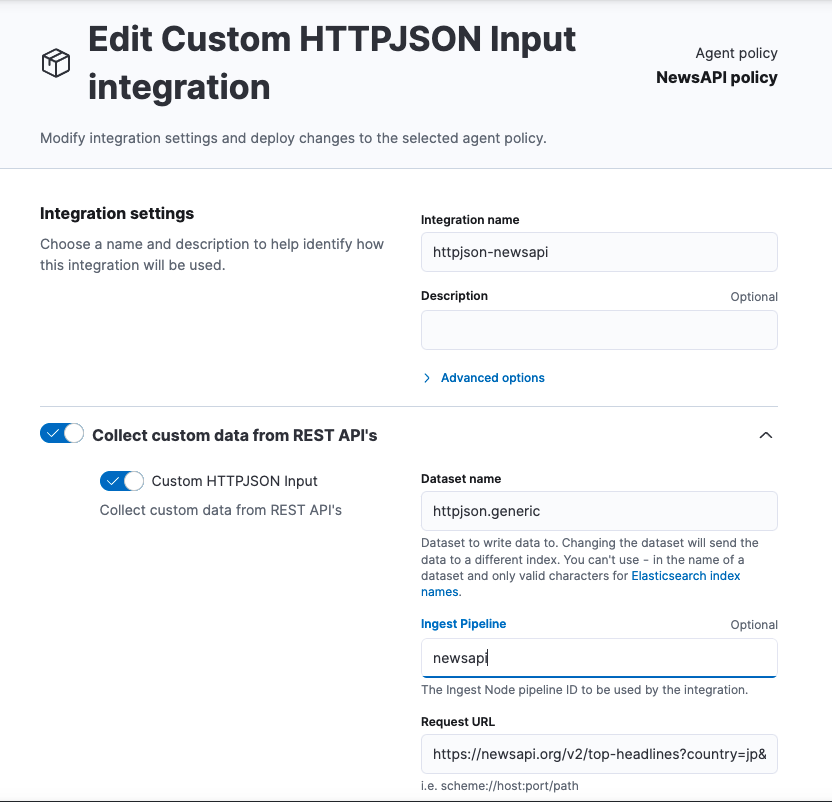
Kibanaの Fleet > Agent policies から NewsAPI policyを選択し、NewsAPI policyのhttpjson-newsapi Integrationの設定で、今作成したnewsapi Ingest Pipelineを通すように変更して、保存します。Elastic AgentへのPolicyの変更は、自動的に反映されます。
これで行けるかと思いきや、Index時にElasticsearchのIndexでmessageフィールドのtypeが違うと怒られてしまいます。
"message": Cannot index event publisher.Event{Content:beat.Event{Timestamp:time.Date(2022, time.May, 9, 14, 36, 17, 853966000, time.Local),

(中略)

"caused_by":{"type":"illegal_state_exception","reason":"Can't get text on a START_OBJECT at 1:294"}}, dropping event!
なぜかと言うと、Integrationを追加した時に、一緒にこのIntegration向けのIndex Templateが自動的に作成されるのですが、そこでmessageフィールドのtypeが、"message" : { "type" : "match_only_text" }となっているからなんですね。
ということで、Pipelineを次のように変更し、新たにnewsフィールドにデコードし、元のmessageフィールドは、Remove するようにします。
PUT _ingest/pipeline/newsapi
{
  "processors": [
    {
      "json": {
        "field": "message",
        "target_field": "news",
        "ignore_failure": true
      }
    },
    {
      "remove": {
        "field": "message",
        "ignore_missing": true
      }
    }
  ]
}
Indexされたイベントは以下のようになります。
{
  "_index": ".ds-logs-httpjson.generic-default-2022.05.09-000001",
  "_id": "UCRfp4ABTzCLm8jB593Q",
  "_version": 1,
  "_score": 1,
  "_source": {
    "news": {
      "publishedAt": "2022-05-08T21:38:15Z",
      "author": "ローカルニュース",
      "urlToImage": "https://news.local/hogehoge/hogehoge.jpg",
      "description": "今日、なんとも嬉しい出来事がありました!",
      "source": {
        "name": "News.local",
        "id": null
      },
      "title": "これはニュースだ!",
      "content": null,
      "url": "https://news.local/hogehoge.html"
    },
    "agent": {
      "name": "hogehoge.local",
      "id": "ae90094c-cce4-4c70-97e6-3b09bf6f28cc",
      "ephemeral_id": "370bb4e4-9ae2-4d9b-9969-5a9d5804466c",
      "type": "filebeat",
      "version": "8.2.0"
    },
    "elastic_agent": {
      "id": "ae90094c-cce4-4c70-97e6-3b09bf6f28cc",
      "version": "8.2.0",
      "snapshot": false
    },
    "tags": [
      "forwarded"
    ],
    "input": {
      "type": "httpjson"
    },
    "@timestamp": "2022-05-09T05:52:00.899Z",
    "ecs": {
      "version": "8.0.0"
    },
    "data_stream": {
      "namespace": "default",
      "type": "logs",
      "dataset": "httpjson.generic"
    },
    "event": {
      "agent_id_status": "verified",
      "ingested": "2022-05-09T05:52:01Z",
      "created": "2022-05-09T05:52:00.899Z",
      "dataset": "httpjson.generic"
    }
  }
}
いい感じです。。。
4. null-value フィールドに対応する
しかし、Indexされたイベントをよくよく見ると、source.idやauthorがnullであるarticleがたまに存在します。これはちょっと気持ち悪いので、これらのフィールドがnullの場合は、source.nameをセットするようにしたいと思います。Set processor の override optionをfalseにすることで、ターゲットfieldがnon-nullの場合は値がセットされないようになります。
PUT _ingest/pipeline/newsapi
{
  "processors": [
    {
      "json": {
        "field": "message",
        "target_field": "news",
        "ignore_failure": true
      }
    },
    {
      "remove": {
        "field": "message",
        "ignore_missing": true
      }
    },
    {
      "set": {
        "field": "news.source.id",
        "override": false,
        "ignore_failure": true,
        "copy_from": "news.source.name"
      }
    },
    {
      "set": {
        "field": "news.author",
        "override": false,
        "ignore_failure": true,
        "copy_from": "news.source.name"
      }
    }
  ]
}
5. @timestampを書き換える
仕上げに、イベントの@timestampを、処理した時間であるprocessing timeから、イベントが発生した時間であるevent timeに書き換えます。これは、Date processor で処理することができます。puhlishedAtが、ニュース記事が投稿された時間なので、このフィールドを使います。幸いpublishedAtの形式は、ISO8601でサポートされている形式なので、formatsにはISO8601と書けばOKです。
PUT _ingest/pipeline/newsapi
{
  "processors": [
    {
      "json": {
        "field": "message",
        "target_field": "news",
        "ignore_failure": true
      }
    },
    {
      "remove": {
        "field": "message",
        "ignore_missing": true
      }
    },
    {
      "set": {
        "field": "news.source.id",
        "override": false,
        "ignore_failure": true,
        "copy_from": "news.source.name"
      }
    },
    {
      "set": {
        "field": "news.author",
        "override": false,
        "ignore_failure": true,
        "copy_from": "news.source.name"
      }
    },
    {
      "date": {
        "field": "news.publishedAt",
        "formats": [
          "ISO8601"
        ],
        "ignore_failure": true
      }
    }
  ]
}
最終的にIndexされたイベントは以下のようになります。
{
  "_index": ".ds-logs-httpjson.generic-default-2022.05.09-000001",
  "_id": "MCRyp4ABTzCLm8jBOd-w",
  "_version": 1,
  "_score": 1,
  "_source": {
    "news": {
      "publishedAt": "2022-05-08T21:38:15Z",
      "author": "ローカルニュース",
      "urlToImage": "https://news.local/hogehoge/hogehoge.jpg",
      "description": "今日、なんとも嬉しい出来事がありました!",
      "source": {
        "name": "News.local",
        "id": "News.local"
      },
      "title": "これはニュースだ!",
      "content": null,
      "url": "https://news.local/hogehoge.html"
    },
    "agent": {
      "name": "hogehoge.local",
      "id": "ae90094c-cce4-4c70-97e6-3b09bf6f28cc",
      "type": "filebeat",
      "ephemeral_id": "370bb4e4-9ae2-4d9b-9969-5a9d5804466c",
      "version": "8.2.0"
    },
    "elastic_agent": {
      "id": "ae90094c-cce4-4c70-97e6-3b09bf6f28cc",
      "version": "8.2.0",
      "snapshot": false
    },
    "tags": [
      "forwarded"
    ],
    "input": {
      "type": "httpjson"
    },
    "@timestamp": "2022-05-08T21:38:15.000Z",
    "ecs": {
      "version": "8.0.0"
    },
    "data_stream": {
      "namespace": "default",
      "type": "logs",
      "dataset": "httpjson.generic"
    },
    "event": {
      "agent_id_status": "verified",
      "ingested": "2022-05-09T06:12:02Z",
      "created": "2022-05-09T06:12:01.235Z",
      "dataset": "httpjson.generic"
    }
  }
}
6. Mappingを綺麗にする
さて、NewsAPIから取得した記事を、Elastic AgentでElasticsearchにIndexするところまでできましたが、先のステップで追加したnewsフィールドは、Dynamic mappingで作成されているため、実はあまりいい形ではありません。Mappingを確認すると、全てのフィールドがkeywordになってしまっています。
{
  "news" : {
    "properties" : {
      "author" : {
        "type" : "keyword",
        "ignore_above" : 1024
      },
      "content" : {
        "type" : "keyword",
        "ignore_above" : 1024
      },
      "description" : {
        "type" : "keyword",
        "ignore_above" : 1024
      },
      "publishedAt" : {
        "type" : "keyword",
        "ignore_above" : 1024
      },
      "source" : {
        "properties" : {
          "id" : {
            "type" : "keyword",
            "ignore_above" : 1024
          },
          "name" : {
            "type" : "keyword",
            "ignore_above" : 1024
          }
        }
      },
      "title" : {
        "type" : "keyword",
        "ignore_above" : 1024
      },
      "url" : {
        "type" : "keyword",
        "ignore_above" : 1024
      },
      "urlToImage" : {
        "type" : "keyword",
        "ignore_above" : 1024
      }
    }
  }
}
最終的には、次のようにMappingを適切な形に整えたいところです。
{
  "news" : {
    "properties" : {
      "author" : {
        "ignore_above" : 1024,
        "type" : "keyword",
        "fields" : {
          "text" : {
            "type" : "text"
          }
        }
      },
      "content" : {
        "ignore_above" : 1024,
        "type" : "keyword",
        "fields" : {
          "text" : {
            "type" : "text"
          }
        }
      },
      "description" : {
        "ignore_above" : 1024,
        "type" : "keyword",
        "fields" : {
          "text" : {
            "type" : "text"
          }
        }
      },
      "publishedAt" : {
        "type" : "date"
      },
      "source" : {
        "properties" : {
          "id" : {
            "type" : "keyword",
            "ignore_above" : 1024
          },
          "name" : {
            "ignore_above" : 1024,
            "type" : "keyword",
            "fields" : {
              "text" : {
                "type" : "text"
              }
            }
          }
        }
      },
      "title" : {
        "ignore_above" : 1024,
        "type" : "keyword",
        "fields" : {
          "text" : {
            "type" : "text"
          }
        }
      },
      "url" : {
        "type" : "keyword",
        "ignore_above" : 1024
      },
      "urlToImage" : {
        "type" : "keyword",
        "ignore_above" : 1024
      }
    }
  }
}
前のステップで Agent Policyを作成した時に、一緒にこのIntegration向けのIndex Templateが自動的に作成される と説明しましたが、そのIndex Templateは、logs-httpjson.genericという名前のTemplateになります。Kibanaから見てみると、なにやらManagedとタグ付けされているし、自分の預かり知らない複数のComponent Templatesで構成されているし、どう編集して良いものかどうか悩んでしまいます。
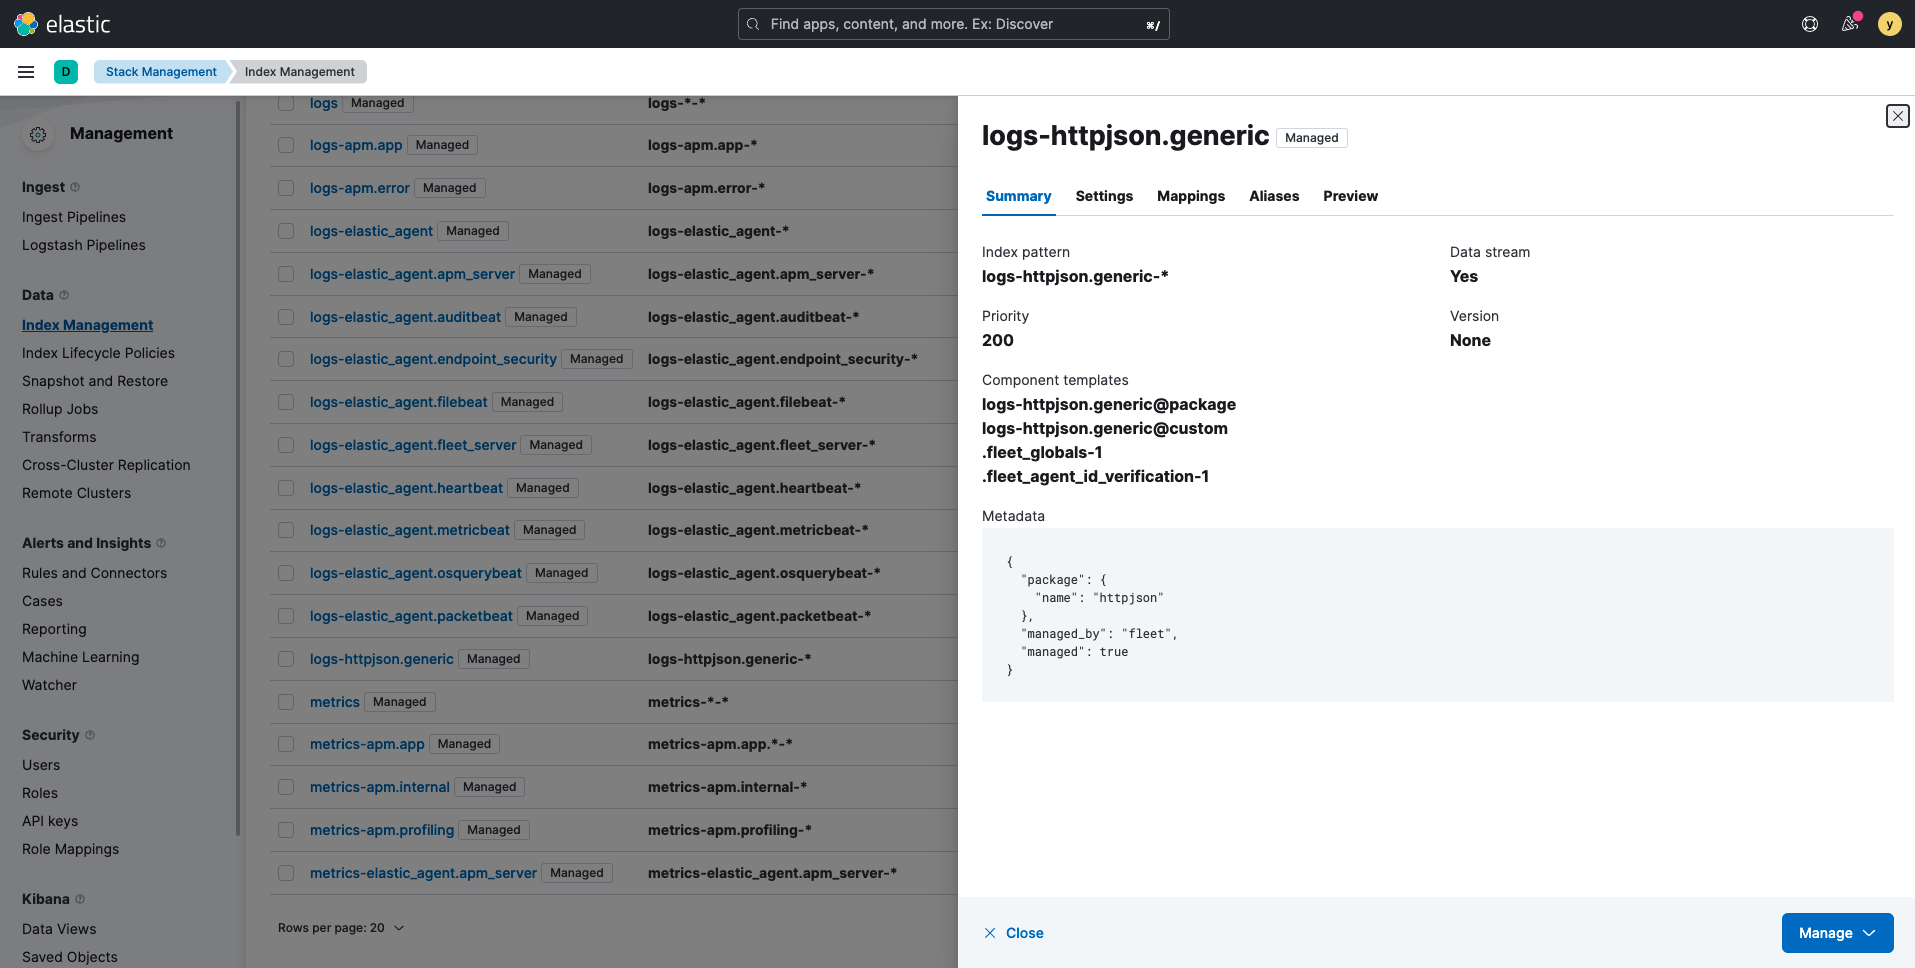
Elastic Agentは、内部的にElasticsearchのDatastreamやILMの機能をうまく活用して、Indexの管理をある意味上手く隠蔽しているわけですが、逆に カスタムな 時系列データを取り込む際に、この辺りの隠蔽された部分をどの程度さわっていいのか? というところにハマってしまいがち、と個人的には思います。。。
7. まとめて綺麗に
ということで、 Mappingの変更を反映して、綺麗にまとめていきましょう。まず、前述のnewsフィールドを定義するComponent Templateを作成します。Kibanaの Stack Management > Index Management > Component Templates から Create component templateをクリックして、logs-httpjson.generic-qa@customと名前をつけます。
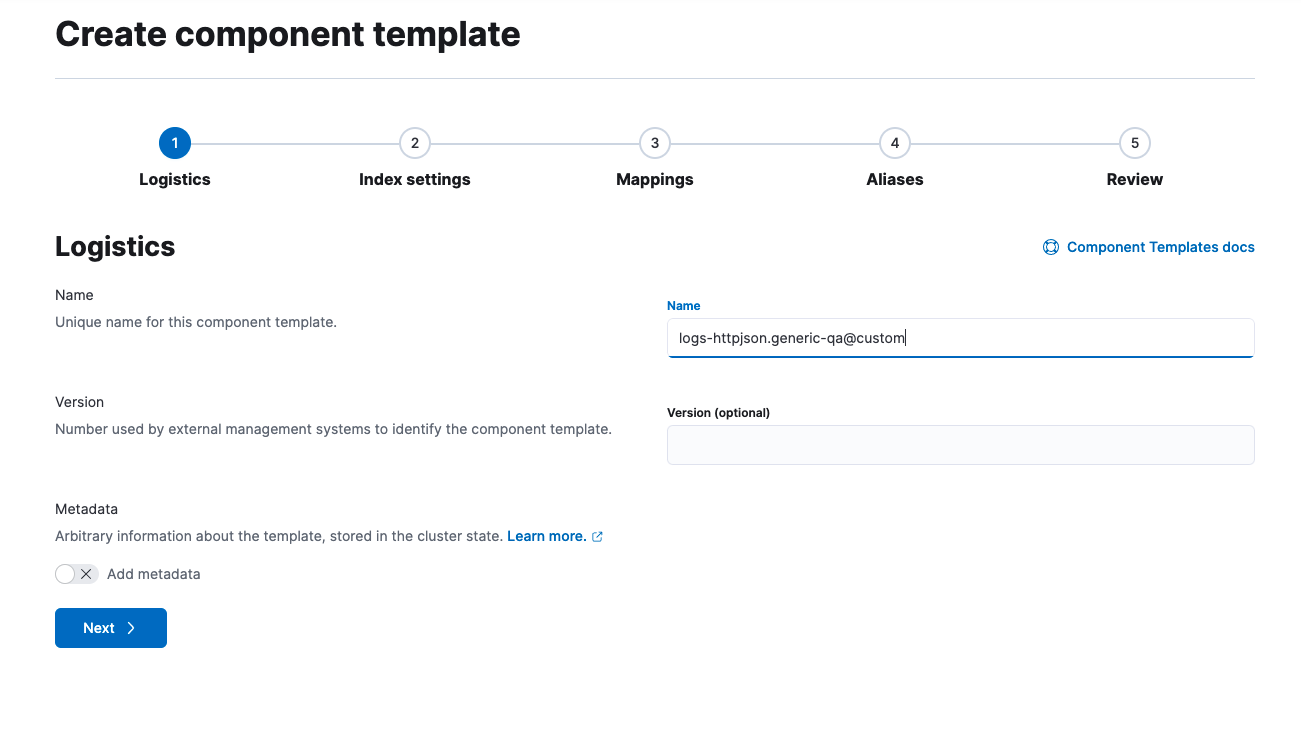
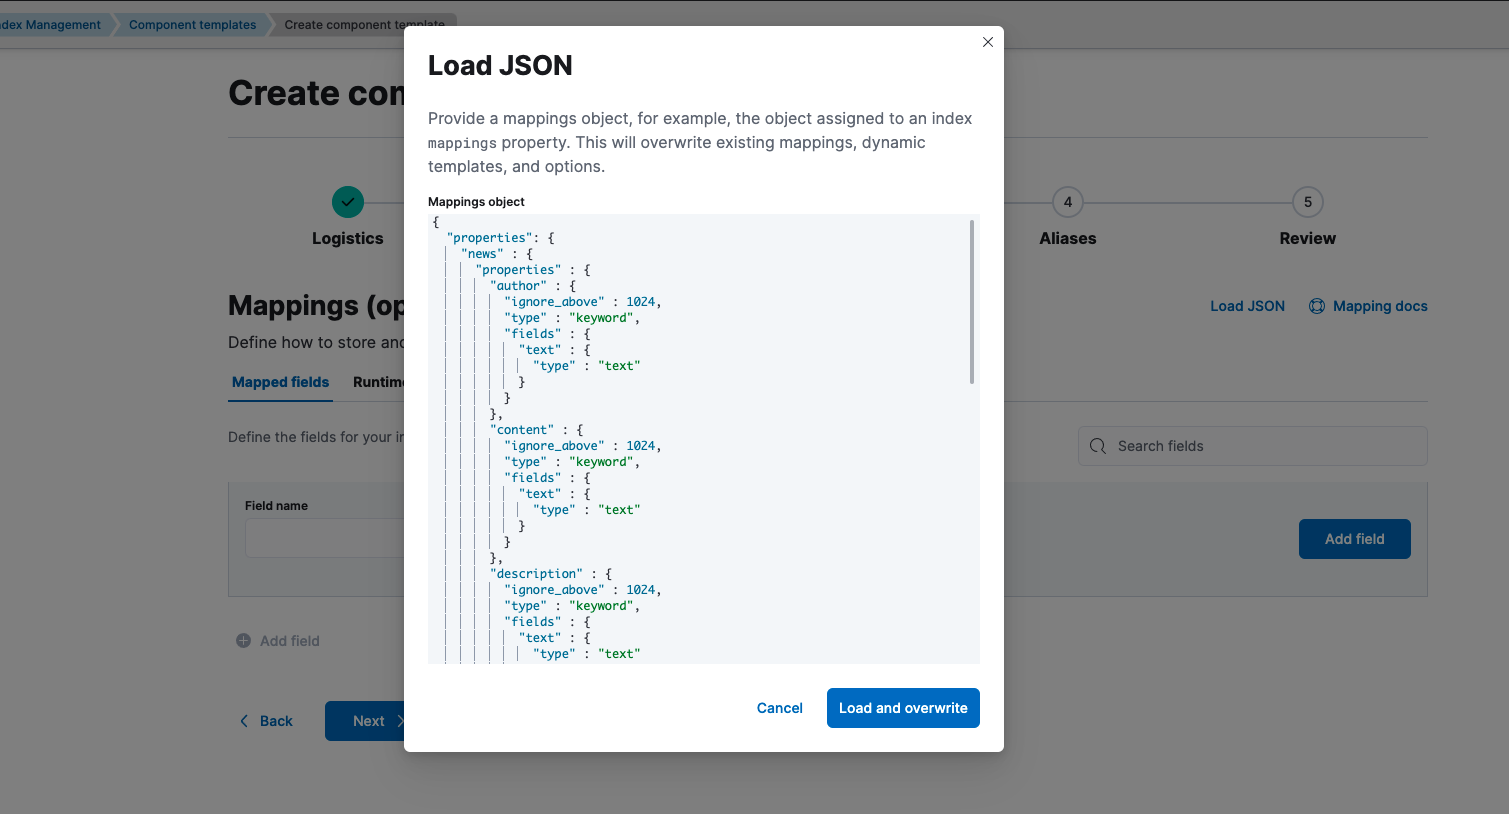
Mappingタブで、Load JSONをクリックして、前述のnewsフィールドをMappings objectとしてコピペし、ロードします。あとは、Nextで最後まで行って、Create component templateをクリックすればOKです。これで、newsフィールド部分のMappingのパーツができました。
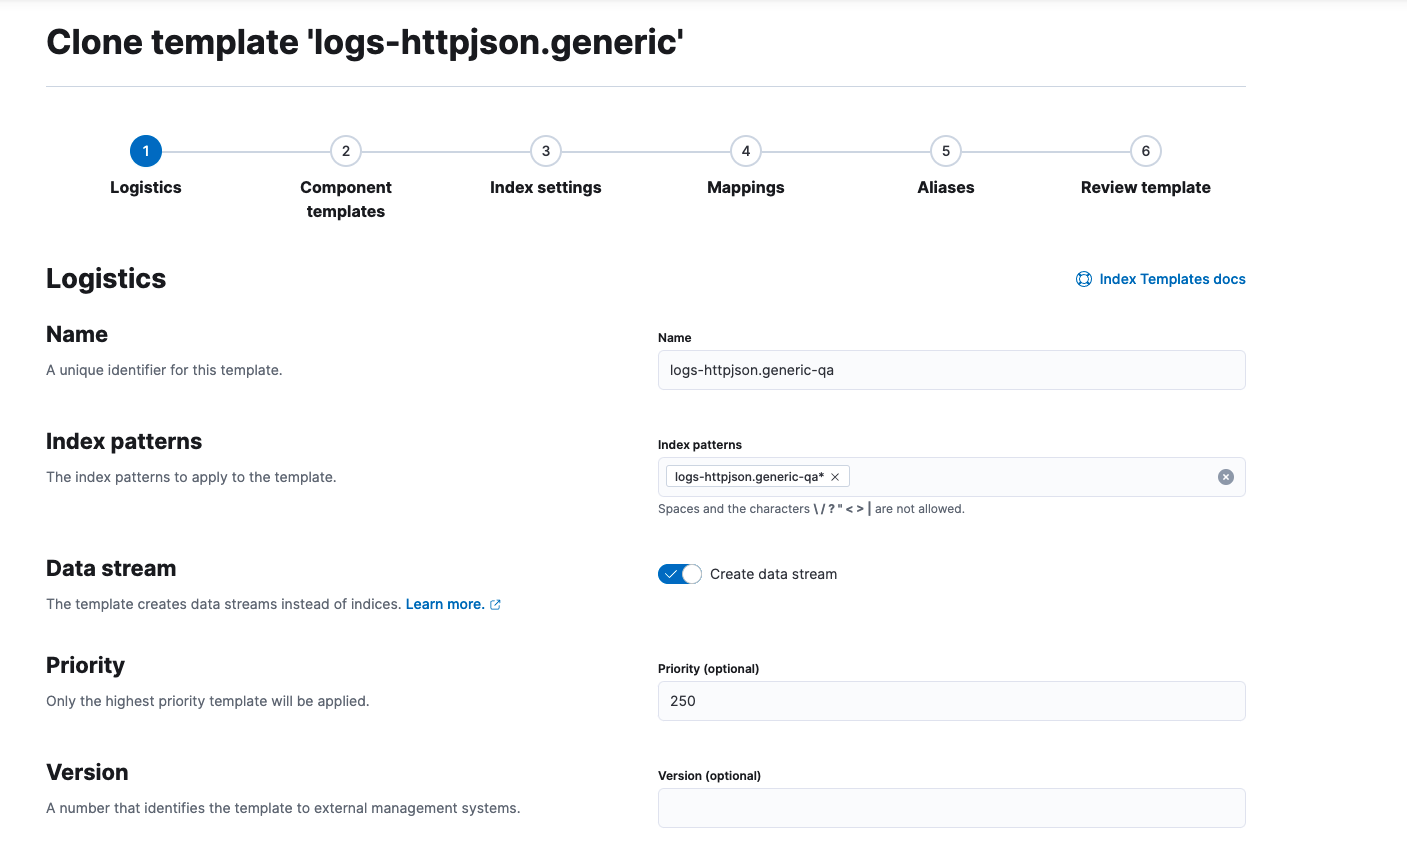
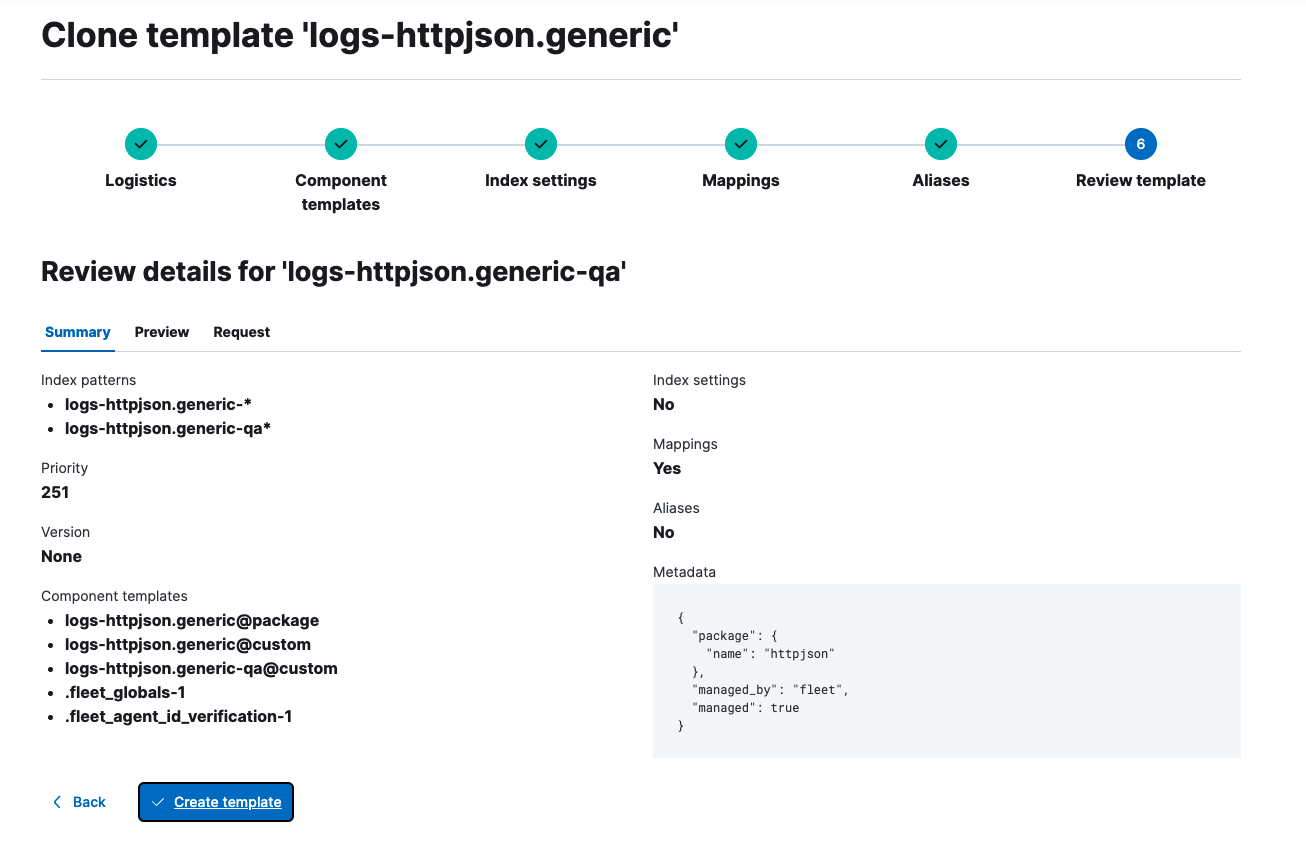
次に、Stack Management > Index Management > Index Templates から既存のIndex Template logs-httpjson.generic をクローンして、新しいIndex Template logs-httpjson.generic-qa を作成します。ここでのポイントは、Index patternsを logs-httpjson.generic-qa* とすることと、Priorityをデフォルトの200より高い値250に設定することです。
そして、先ほど作成したのComponent Template logs-httpjson.generic-qa@customを含むようにします。順番は、既存の@custom Templateの次でOKです。
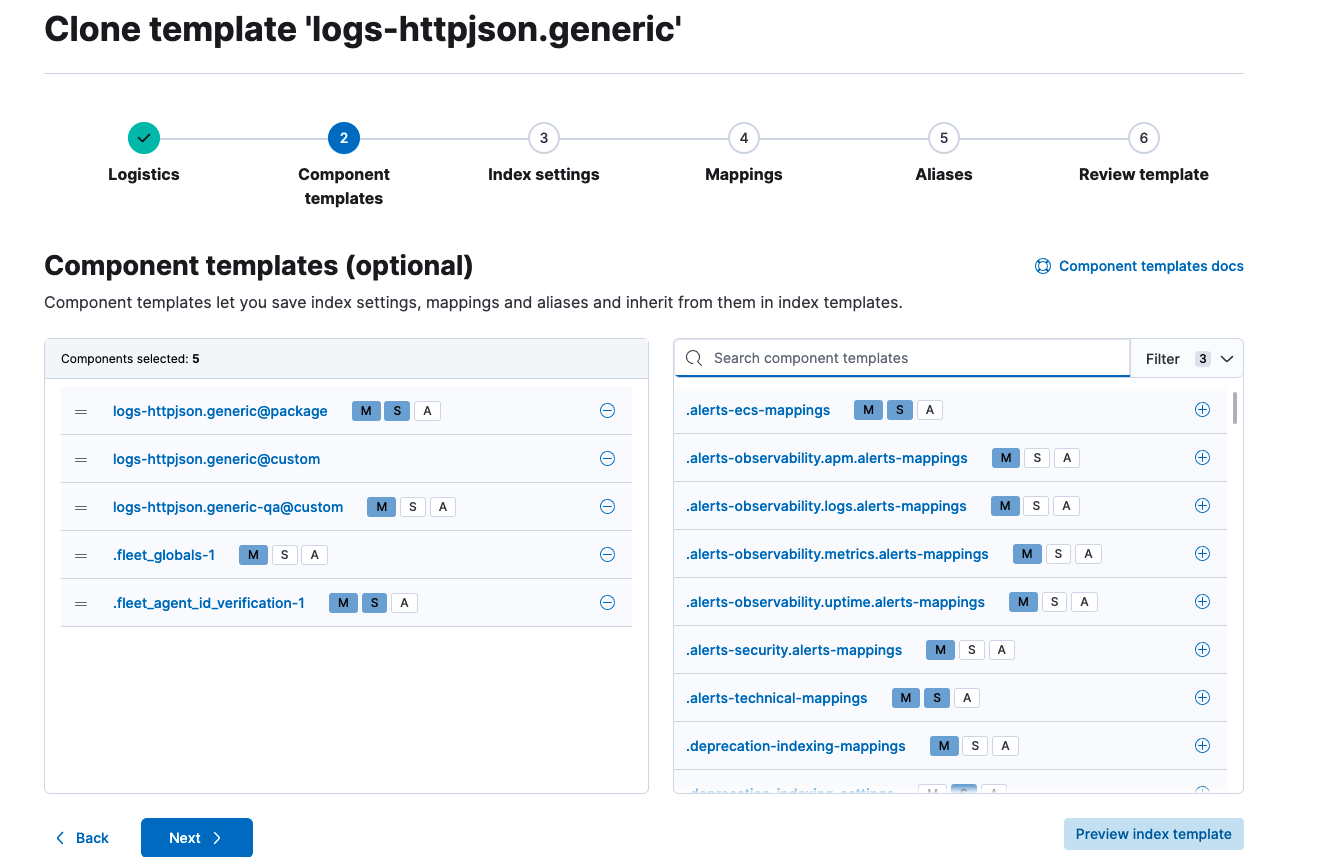
あとは、Nextで最後まで行って、Create templateでOKです。これで、先ほど作成したパーツを含む新しいIndex Templateができました。
最後にElastic AgentのPolicyを書き換えます。Kibanaの Fleet > Agent policies から NewsAPI policyを選択し、httpjson-newsapi Integrationをクリックします。ここでの唯一の変更点は、Namespace に qaと入力することです。
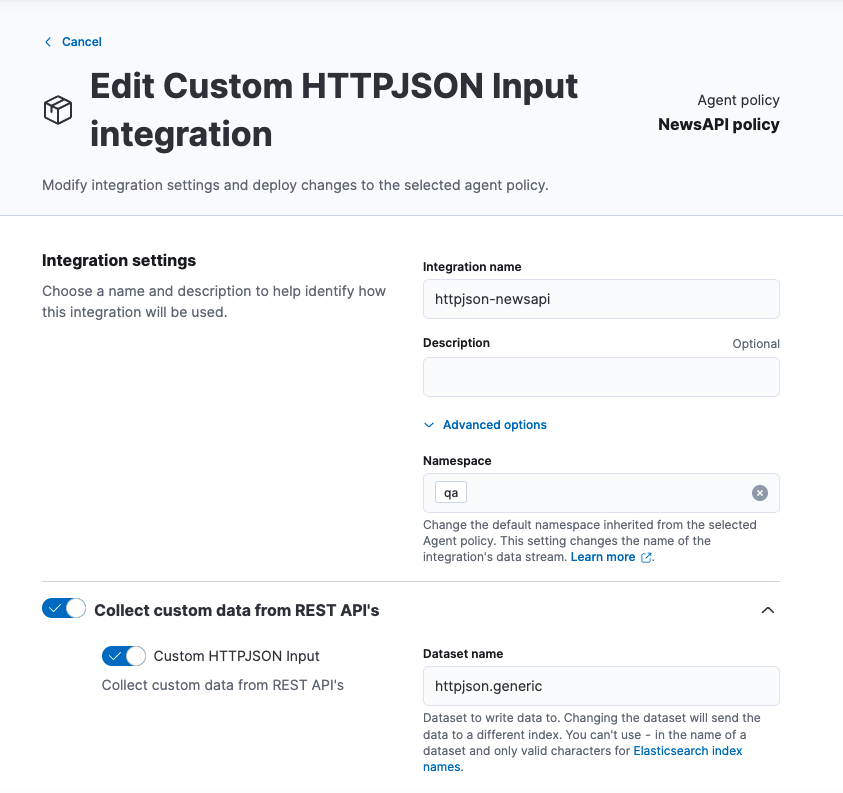
これによって、変更後のhttpjson-newsapi Integrationは、先ほど作成したlogs-httpjson.generic-qa Index Templateを使って、logs-httpjson.generic-qaというDatastreamにイベントをIndexすることになりました。
GET _data_stream/logs-httpjson.generic-qa
レスポンス:
{
  "data_streams" : [
    {
      "name" : "logs-httpjson.generic-qa",
      "timestamp_field" : {
        "name" : "@timestamp"
      },
      "indices" : [
        {
          "index_name" : ".ds-logs-httpjson.generic-qa-2022.05.09-000001",
          "index_uuid" : "z9XgsjRCTkSxZXm9kMv3kw"
        }
      ],
      "generation" : 1,
      "_meta" : {
        "package" : {
          "name" : "httpjson"
        },
        "managed" : true,
        "managed_by" : "fleet"
      },
      "status" : "GREEN",
      "template" : "logs-httpjson.generic-qa",
      "ilm_policy" : "logs",
      "hidden" : false,
      "system" : false,
      "allow_custom_routing" : false,
      "replicated" : false
    }
  ]
}
ここで使ったqaという名前自体には大した意味はありませんが、logs-httpjson.generic-qaといった ネーミングルールの理解が、ある意味、Elastic Agentを使いこなす鍵となる と言っても過言ではありません。
logs-httpjson.generic-qa
というDatastream名は、
<type>-<dataset>-<namespace>
というルールからきています。先ほどのスクリーンショットを見ると、Dataset nameはhttpjson.generic、Namespaceはqa となっていることがわかります。詳細については 公式ドキュメント を参考にしてみてください。
まとめ
今回、Elastic AgentとIngest Pipelineを使って、以下のことをやってみました。
| やりたいこと | 方法 |
|---|---|
| HTTP APIでJSONを取り込む | Custom HTTPJSON Input (Elastic Agent) |
| JSON文字列をデコード | JSON processor (Ingest Pipeline) |
| null-valueフィールド対応 | Set processor (Ingest Pipeline) |
| @timestamp書き換え | Date processor (Ingest Pipeline) |
Elastic Agent + Integrationsの組み合わせで、かなりの数のデータソースが扱えてしまうのですが、こんな風にカスタムなデータソースの場合でも、Ingest Piplelineとの組み合わせで、様々な対応ができます。Agent側の構成管理は、これまでより格段に楽になるので、ぜひ試してみてください。
- 2022-05-28追記: Elasticsearchにカスタム時系列データを取り込む (Filebeat編)