ずっと避けてきたmatplotlibを勉強する
何故か、面倒だという理由から避けてきましたが、オライリーの本を買ったので、これを機に勉強する。
今回買った本はこちら、「Python for Data Analysis 2nd Edition」
この本の第9章を眺めていこうと思います。
本書では、十分なスペースがないとのことですが、使いこなしていくための下地を作来るのが目的とのこと。
データ分析という意味合いが強いですが、普段の業務にも多岐に渡って活躍してくれると信じています。
matplotlib
Pythonには組み込みのビジュアライゼーションライブラリがあるらしい(使ったことないです)今回は、本に沿って、matplotlibを使っていきます。
環境は CentOS7 Jupyter-notebookにて
1. 最も単純なパターン
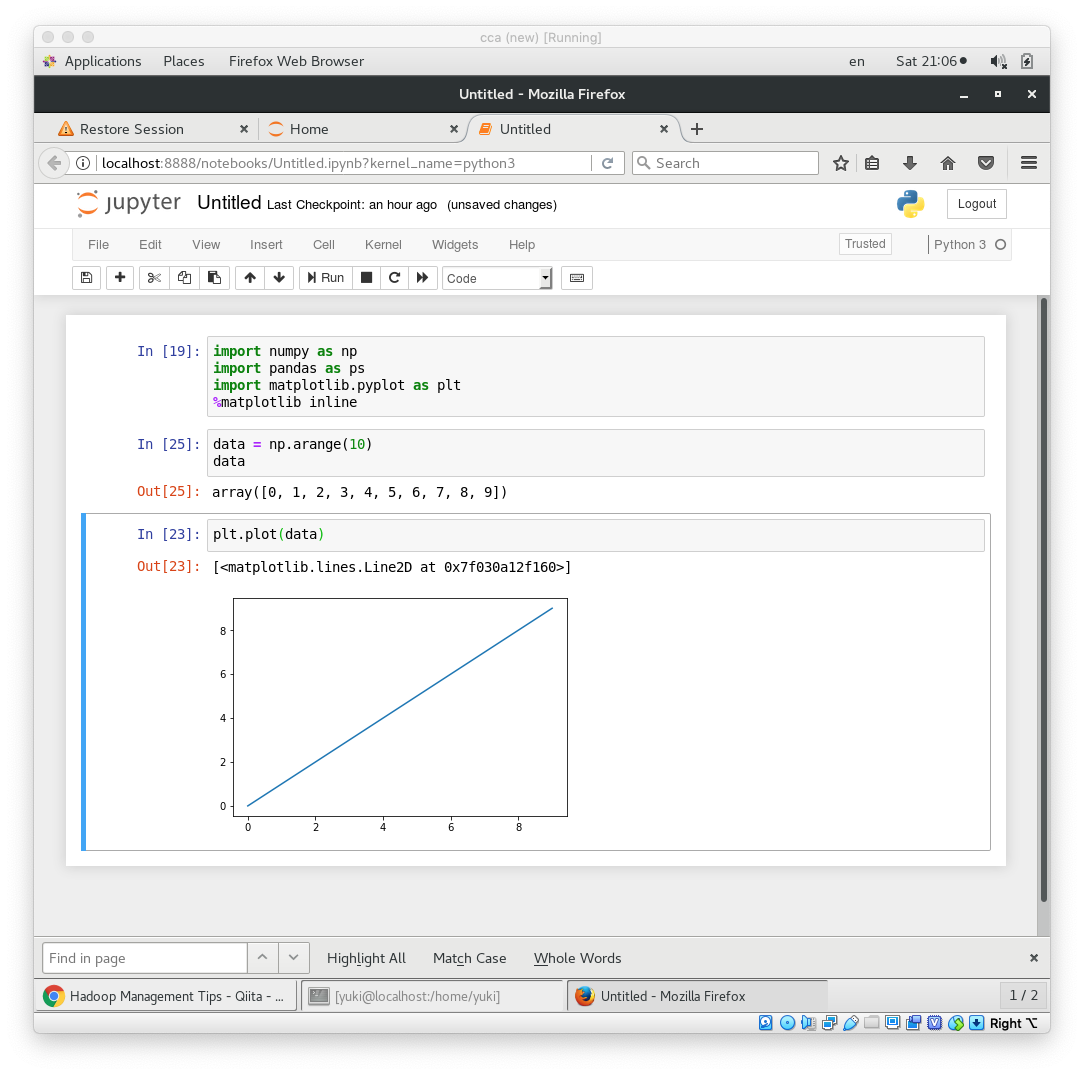
描写される部分が plot とよばれるらしいです。
import numpy as np
import pandas as ps
import matplotlib.pyplot as plt
%matplotlib inline

data = np.arange(10)
data

plt.plot(data)
うーん。なんか動いたけどよくわからないなぁ。
一次元のデータなのに2次元で表示された。
y=x の1次関数ぽい
2. sub plot
plot は Figureオブジェクトの中に含まれているとのこと。そのため
ax1 = fig.add_subplot(2, 2, 1)
とすることでplotに図を追加することができる。
2*2の場所を作成して、その1つめということとのこと。
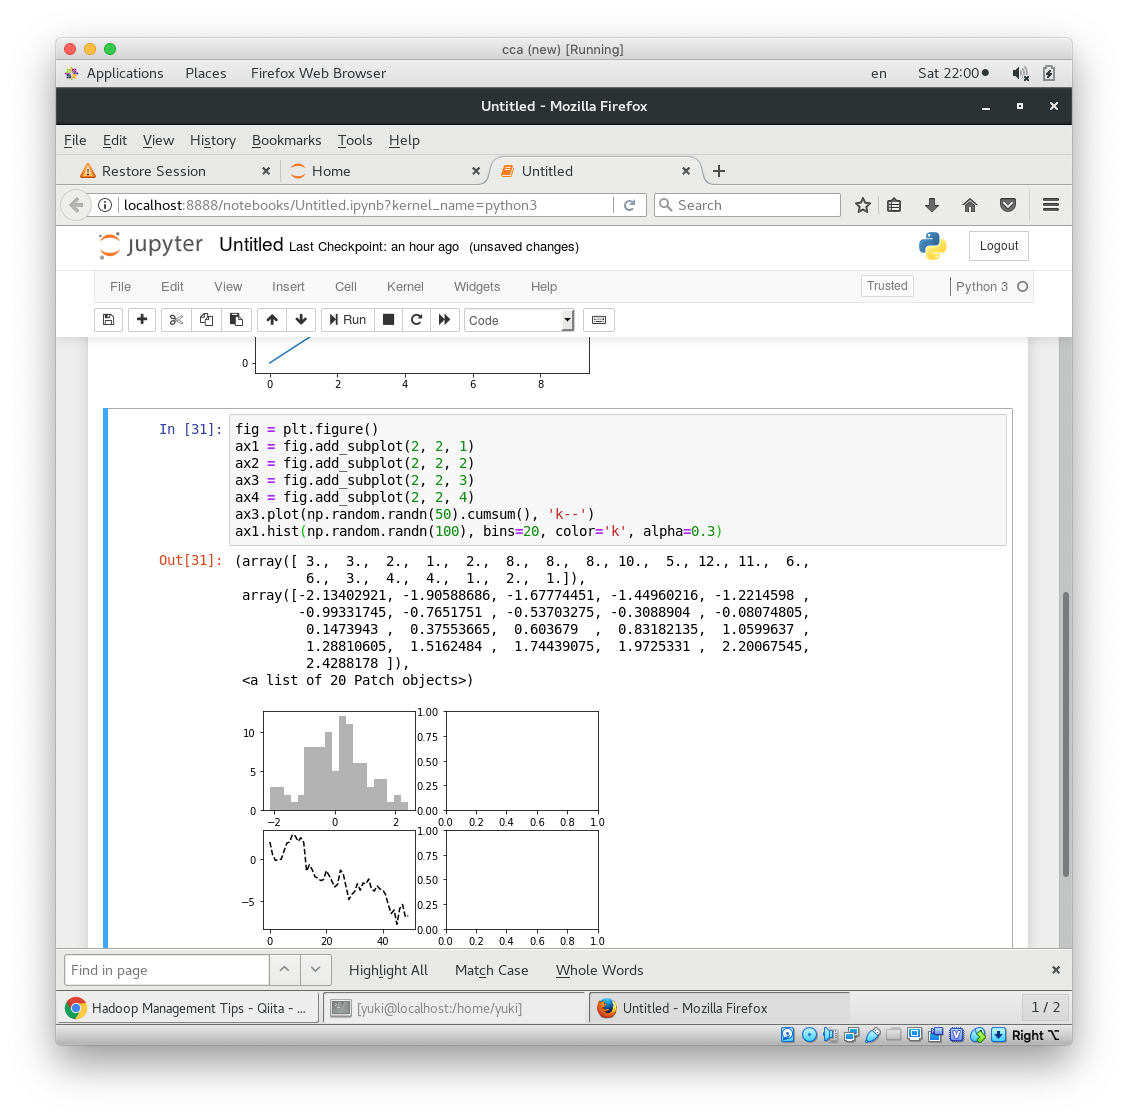
fig = plt.figure()
ax1 = fig.add_subplot(2, 2, 1)
ax2 = fig.add_subplot(2, 2, 2)
ax3 = fig.add_subplot(2, 2, 3)
ax4 = fig.add_subplot(2, 2, 4)
ax3.plot(np.random.randn(50).cumsum(), 'k--')
ax1.hist(np.random.randn(100), bins=20, color='k', alpha=0.3, 'ko--')
cusumはcumulative sumなので累積。
最後のk--はスタイルオプションと言って、描画のオプションを決める事ができる。
k--は黒色の破線。 --の部分が破線*-というように線のスタイルを決めることができる。
細かいオプションは、公式サイトを見てねという感じだった。
ko--は黒で、データのポイントを●で表示して、破線。
ヒストグラムのbinsはどれだけ、標本を分割するかという値。
ラベリング
今までだと、ラベルや、メモリは自動生成だった。
ある程度データがみえてきたらラベリングしたほうが見やすい。
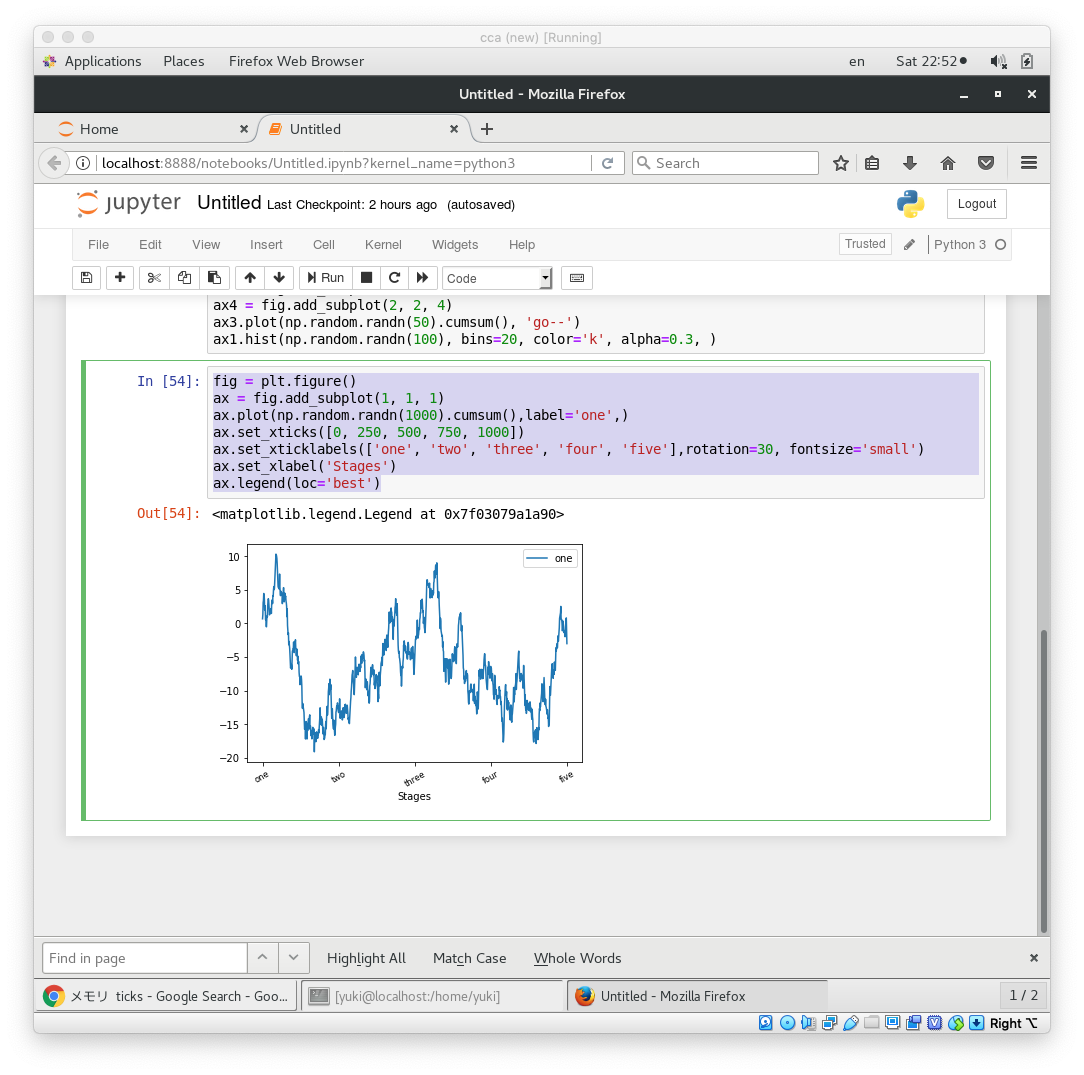
fig = plt.figure()
ax = fig.add_subplot(1, 1, 1)
ax.plot(np.random.randn(1000).cumsum(),label='one',)
ax.set_xticks([0, 250, 500, 750, 1000])
ax.set_xticklabels(['one', 'two', 'three', 'four', 'five'],rotation=30, fontsize='small')
ax.set_xlabel('Stages')
ax.legend(loc='best')
ticksってこと目盛りなので、そのメモリをx軸に対して設定して、そのラベルが1から5というように設定できる。
rotationはラベルをどれだけ傾けるかということとのこと。
legend 伝説的な凡例を入れるにはこれを使う。
昔Excelでやってたなー。。こんなこと。
と思ったら
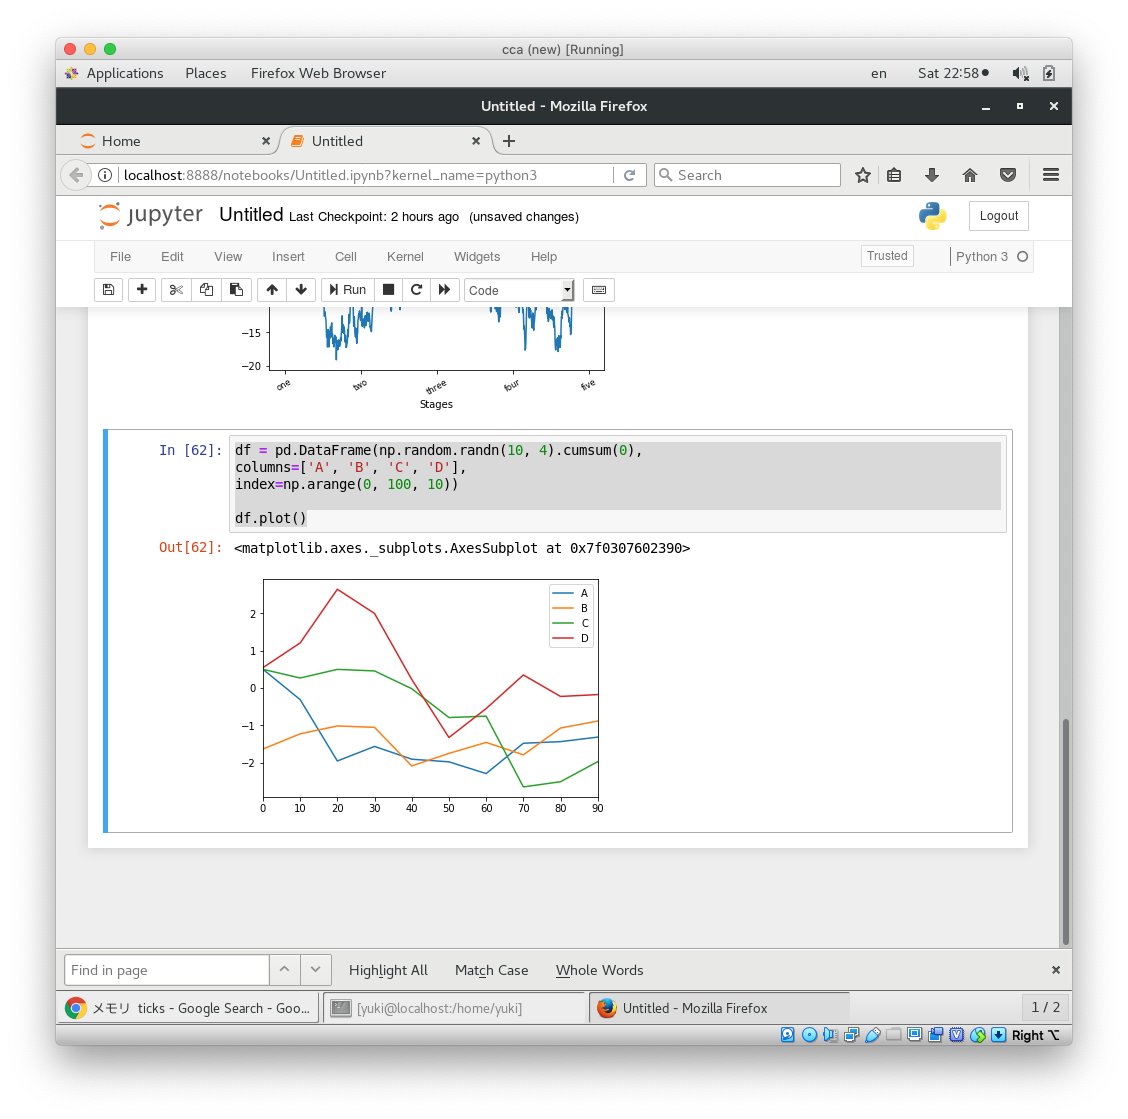
pandas氏にはもうそんな機能が備わっていた。
df = pd.DataFrame(np.random.randn(10, 4).cumsum(0),
columns=['A', 'B', 'C', 'D'],
index=np.arange(0, 100, 10))

df.plot()
ぐぬぬ。
ひとまず
本は最後に、ネットでググって良いリソースをもとにいっぱい勉強してね!って書いてありました。
道は長そうです。


