簡単に速度測定
sub_list = list(range(10000))を空のリストに追加したときの速度を測定してみる。
1. extendの速度
In:
%%timeit

li = []
li.extend(sub_list)
Out:
26.7 µs ± 2.44 µs per loop (mean ± std. dev. of 7 runs, 10000 loops each)
2. 足し算の速度
In:
%%timeit

li = []
li += sub_list
Out:
25.3 µs ± 281 ns per loop (mean ± std. dev. of 7 runs, 10000 loops each)
足し算の方が早く、速度も安定している。extendって組み込み関数なのに遅くね?
詳しく速度測定
この問題には、
- 元のリストの長さ
- 追加するリストの長さ
の2つの変数があるので、それをいじったときの速度を測定する。そして、速度同士の引き算をして、extendと足し算のどちらが勝ったのかを見てみる。
リストが短い場合
- 縦軸:元のリストの長さ
- 横軸:追加するリストの長さ
- 白:
extendの方が早い - 黒:足し算の方が早い
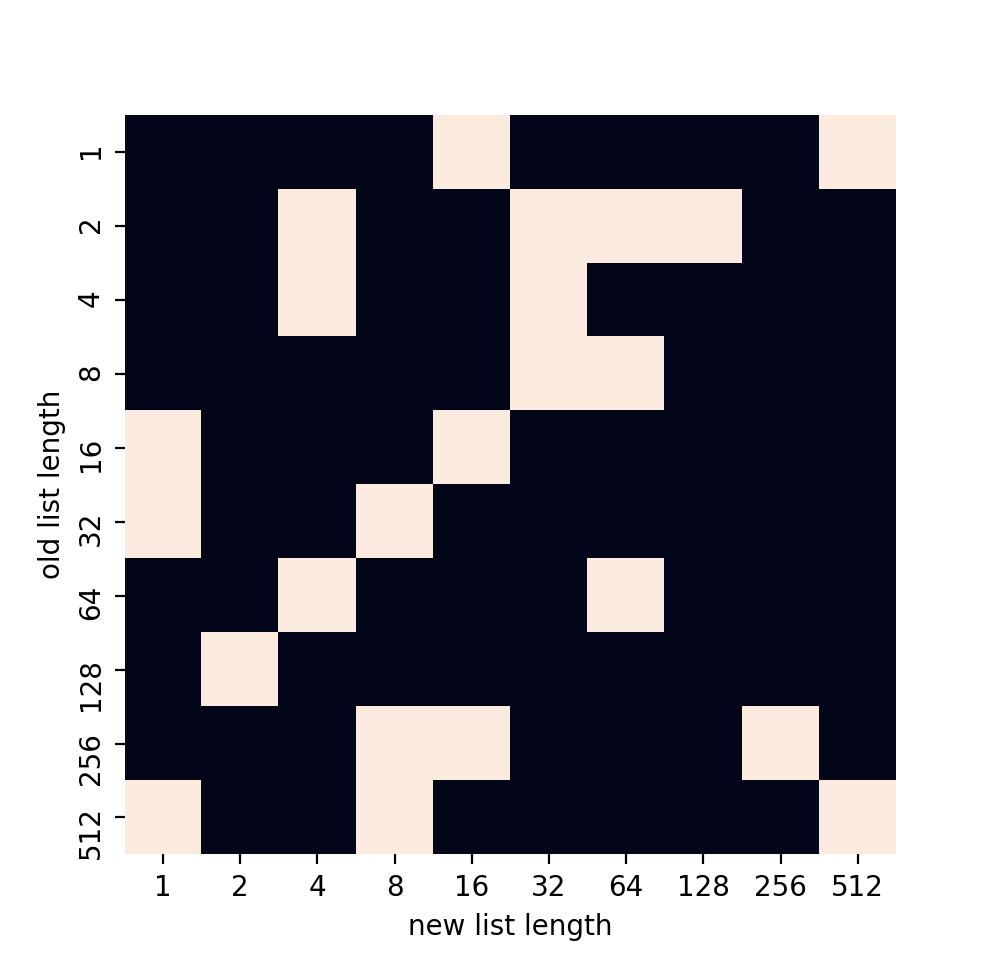
足し算優勢
リストが長い場合
- 縦軸:元のリストの長さ
- 横軸:追加するリストの長さ
- 白:
extendの方が早い - 黒:足し算の方が早い
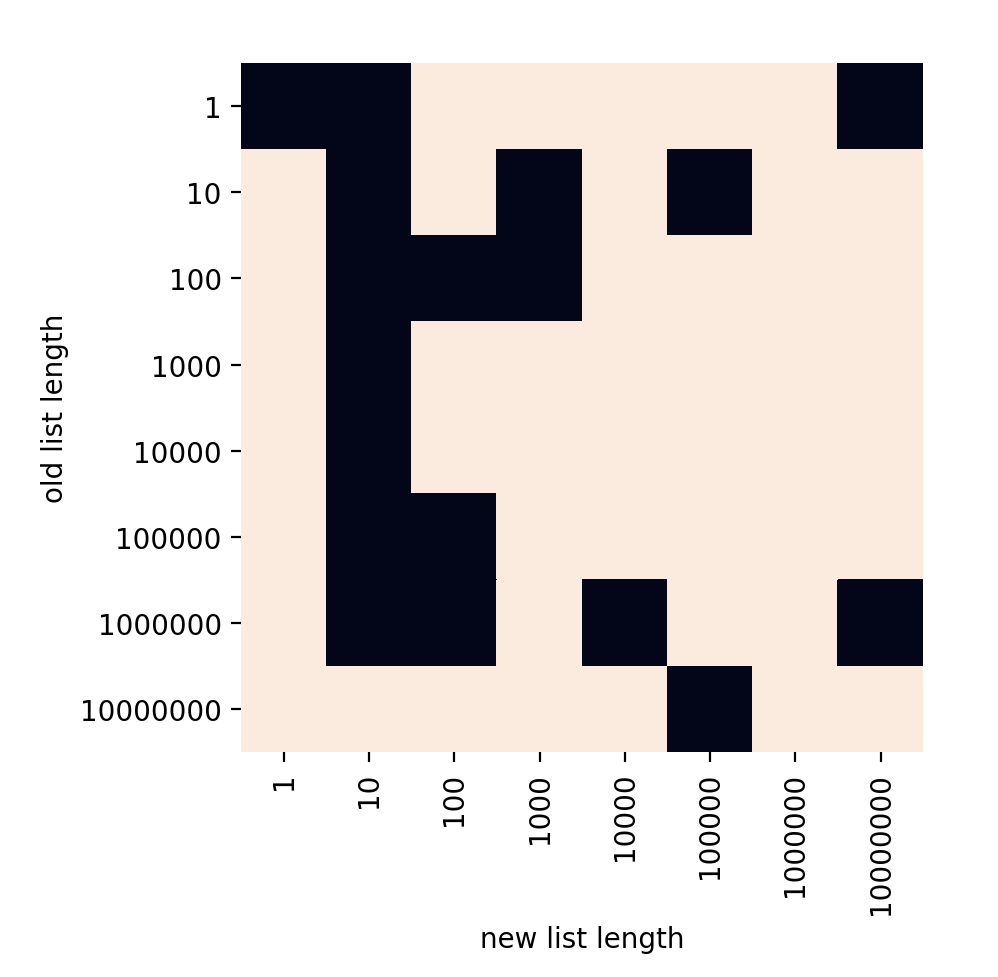
extend優勢
なんだろ、Pythonそもそもの実装に関わってくるのかな?
コード
import matplotlib.pyplot as plt
import numpy as np
import seaborn as sns
from time import time


def extend_time(old_i, new_i):
    old = list(range(10 ** old_i))
    new = list(range(10 ** new_i))
    s = time()
    old.extend(new)
    e = time()
    return e - s


def add_time(old_i, new_i):
    old = list(range(10 ** old_i))
    new = list(range(10 ** new_i))
    s = time()
    old += new
    e = time()
    return e - s


extend_time = np.vectorize(extend_time)
add_time = np.vectorize(add_time)


shape = (8, 8)
extend_graph = np.fromfunction(extend_time, shape, dtype=np.int)
add_graph = np.fromfunction(add_time, shape, dtype=np.int)

result = np.where(extend_graph - add_graph > 0, True, False)
sns.heatmap(result, cbar=False, xticklabels=[10 ** i for i in range(shape[0])], yticklabels=[10 ** i for i in range(shape[0])])
plt.ylabel("old list length")
plt.xlabel("new list length")
plt.show()