環境
- Python3.10.2
- bokeh 2.4.2
やりたいこと
bokehで縦軸が2つの折れ線グラフを描画したいです。
解決
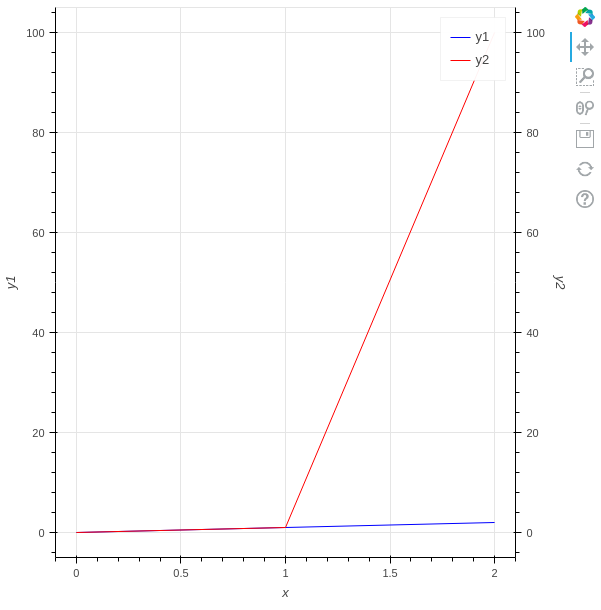
以下のコードで縦軸が2つの折れ線グラフを描画できます。
extra_y_rangesプロパティに軸の範囲を設定して、add_layoutメソッドで軸を右側に追加しています。
from bokeh.models import DataRange1d, LinearAxis
from bokeh.plotting import figure, show

x = [0, 1, 2]
y1 = [0, 1, 2]
y2 = [0, 1, 100]

fig = figure(x_axis_label="x", y_axis_label="y1")
y_range_name = "secondary_axis"
fig.extra_y_ranges = {y_range_name: DataRange1d()}
fig.add_layout(
    LinearAxis(
        y_range_name=y_range_name,
        axis_label="y2",
    ),
    "right",
)

fig.line(x=x, y=y1, legend_label="y1", color="blue")
fig.line(
    x=x,
    y=y2,
    legend_label="y2",
    color="red",
    y_range_name=y_range_name,
)

show(fig)
以下のサイトを参考にしました。
軸の範囲を適切にする
y1の範囲は0~2なのに対して、第1Y軸の範囲は0~100で広すぎます。デフォルトではプロットしたすべての情報から、軸の範囲が決まるため、第1Y軸の範囲はmin(y1,y2)~max(y1,y2)になっています。
Y軸の範囲を適切にしましょう。renderersプロパティを設定すると、指定したプロット情報から、軸の範囲が決まります。
An explicit list of renderers to autorange against. If unset, defaults to all renderers on a plot.
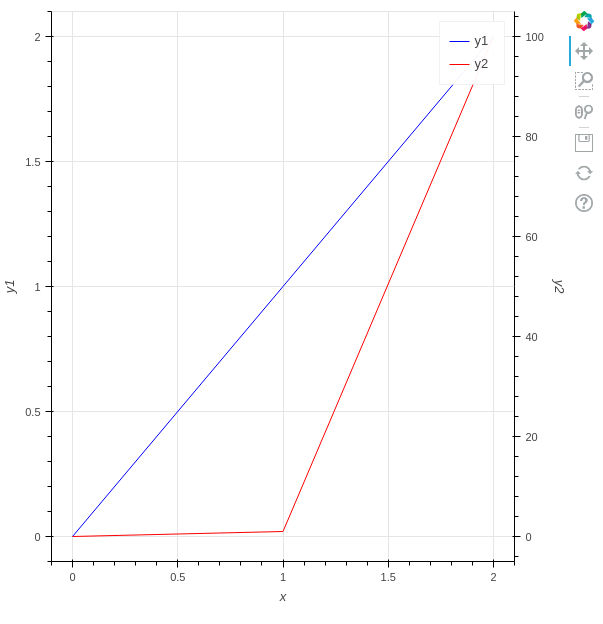
以下のコードを実行すると、第Y軸の範囲が0~2の折れ線グラフが描画されました。
from bokeh.models import DataRange1d, LinearAxis
from bokeh.plotting import figure, show

x = [0, 1, 2]
y1 = [0, 1, 2]
y2 = [0, 1, 100]

fig = figure(x_axis_label="x", y_axis_label="y1")
y_range_name = "secondary_axis"
fig.add_layout(
    LinearAxis(
        y_range_name=y_range_name,
        axis_label="y2",
    ),
    "right",
)

y1_line = fig.line(x=x, y=y1, legend_label="y1", color="blue")
y2_line = fig.line(
    x=x,
    y=y2,
    legend_label="y2",
    color="red",
    y_range_name=y_range_name,
)

fig.y_range.renderers = [y1_line]
fig.extra_y_ranges = {y_range_name: DataRange1d(renderers=[y2_line])}

show(fig)
bokehの質問サイトで教えていただきました。
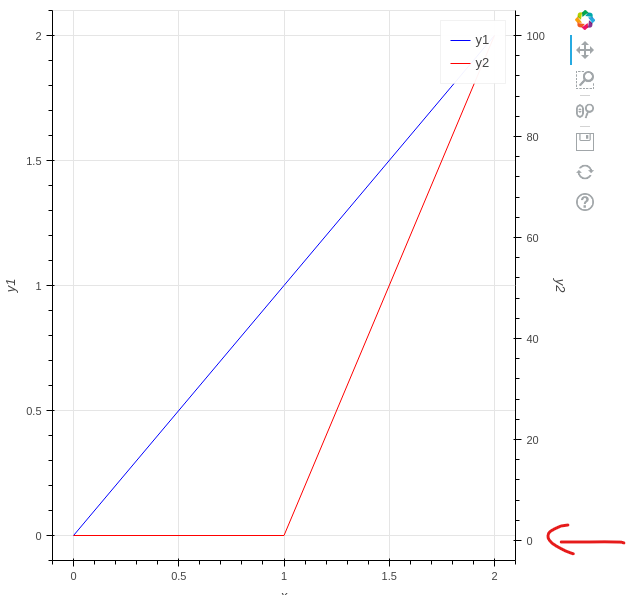
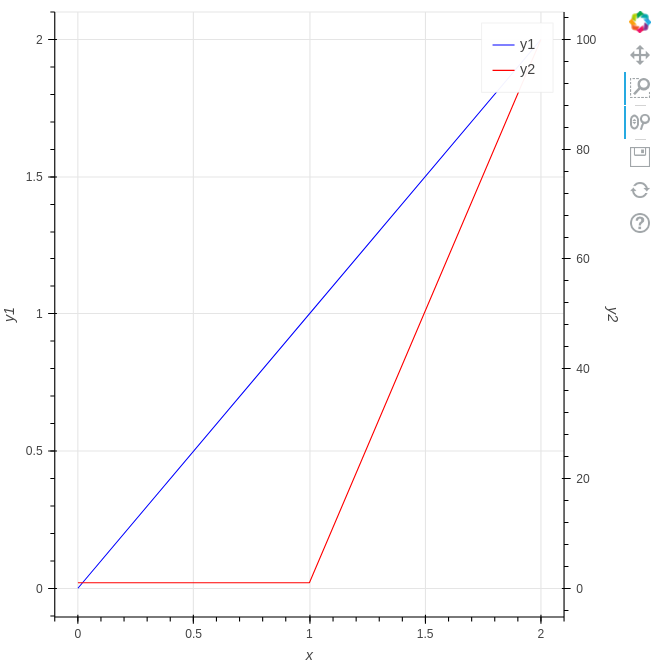
ただしy1とy2の最小値が少し異なる場合、グラフの軸の目盛りが少しズレて、気持ち悪さを感じます。
y1 = [0, 1, 2]
y2 = [1, 1, 100]
このようなときは、DataRange1dのendだけを指定するのがよいです。
startを指定しないことにより、y1とy2の両方の最小値から軸の最小値が決まります。
from bokeh.models import DataRange1d, LinearAxis
from bokeh.plotting import figure, show

x = [0, 1, 2]
y1 = [0, 1, 2]
y2 = [1, 1, 100]

fig = figure(x_axis_label="x", y_axis_label="y1")
y_range_name = "secondary_axis"

y_overlimit = 1.05
fig.y_range = DataRange1d(end=max(y1) * y_overlimit)
fig.extra_y_ranges = {y_range_name: DataRange1d(end=max(y2) * y_overlimit)}

fig.add_layout(
    LinearAxis(
        y_range_name=y_range_name,
        axis_label="y2",
    ),
    "right",
)

y1_line = fig.line(x=x, y=y1, legend_label="y1", color="blue")
y2_line = fig.line(
    x=x,
    y=y2,
    legend_label="y2",
    color="red",
    y_range_name=y_range_name,
)

show(fig)
以下のサイトを参考にしました。
補足
目盛りのコントールは難しい
第1Y軸の水平のグリッド線と第2Y軸のグリッド線はズレています。
可能ならば、このグリッド線を第1Y軸と第2Y軸で一致させたいのですが、これは難しいようです。
bokehのコアメンバーが教えてくれました。
Hopefully with a little consideration, it’s evident why this is not really a trivial thing. Normally we always want axes to have “nice” ticks, and Bokeh’s tickers always try to select “nice” tick values. But in general, there is no possible way to assume that a “nice” tick on one axis will correspond to a “nice” tick on the other axis. It depends entirely on the different range starts and ends and Bokeh has no control over that, only you do. So the best that can be done is let you tell Bokeh what you want when it can’t figure out for itself.
But you don’t have to give up. Setting fixed ticks, in case you want to experiment with that, is pretty trivial: https://docs.bokeh.org/en/latest/docs/user_guide/styling.html#tick-locations 1. It’s probably a workable approach especially if you don’t need to support pan/zoom.
extra_y_rangesプロパティの指定は必須
Y軸の範囲を気にしない場合は、extra_y_rangesプロパティを指定しなくても良いように思いますが、extra_y_rangesは必須です。
extra_y_rangesを指定しないと、以下のエラーが発生します。
ERROR:bokeh.core.validation.check:E-1020 (BAD_EXTRA_RANGE_NAME): An extra range name is configured with a name that does not correspond to any range: y_range_name='secondary_axis' [LinearAxis(id='1033', ...)], y_range_name='secondary_axis' [GlyphRenderer(id='1060', ...)]


