Pythonのグラフ描画ライブラリBokehについての備忘録です。
Bokehとは?
Python製の可視化ライブラリです。
Bokeh is an interactive visualization library that targets modern web browsers for presentation.
環境
- Python 3.6
- Bokeh 0.13.0
設定系
Jupyter Notebookにグラフを表示
output_file()の代わりに、output_notebook()を使います。
from bokeh.plotting import figure, output_file, show,output_notebook

output_notebook()

p = figure(title="simple line example", x_axis_label='x', y_axis_label='y')
p.line(x, y, legend="Temp.", line_width=2)
show(p)
Jupyter Labにグラフを表示
以下のコマンドでJupyter Labの拡張機能をインストール。jupyter labextension install jupyterlab_bokeh.
HTMLを保存するだけでブラウザは開かないようにする
show()の替わりにsave()関数を呼ぶ。
plot系
軸の表示範囲を設定する
# キーワードでは、リストやタプルを渡せる
p = figure(x_range=[2,5], y_range=(2,4))

# プロパティの場合は、Range1dのみ渡せる
p.x_range = bokeh.models.Range1d(2, 5)
# リストやタプルを渡すとエラーが発生する
# p.x_range = [1,2]
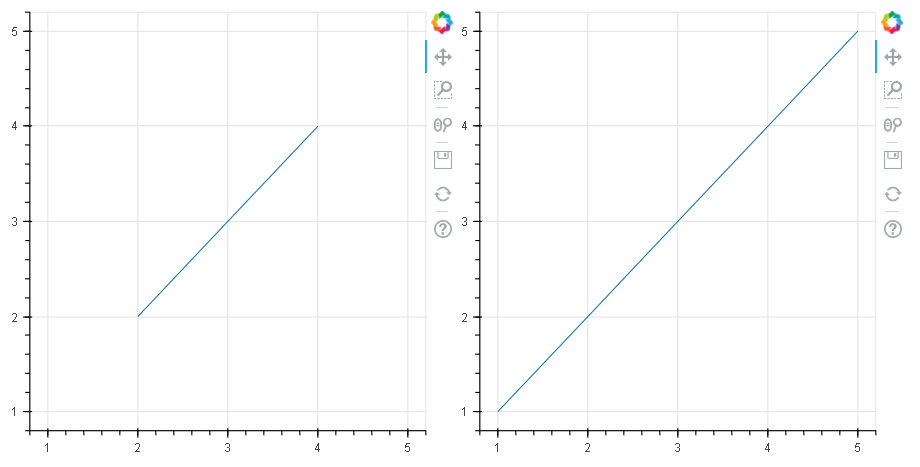
複数のグラフの、グラフ移動やズームを同期させる
figureメソッドのx_range, y_rangeオプションを使います。
from bokeh.plotting import figure, output_file, show,output_notebook
output_notebook()

p1 = figure(plot_width=400, plot_height=400)
p1.line([2,3,4],[2,3,4])

p2 = figure(plot_width=400, plot_height=400, x_range=p1.x_range, y_range=p1.y_range)
p2.line([1, 2, 3, 4, 5], [1, 2, 3, 4, 5])

show(bokeh.layouts.row(p1,p2))
x_range, y_rangeは大きい範囲が採用されるので、どっちのグラフを基準にするかは、考えなくて良いです。(p1.x_rangeは2~4だが、実際のグラフは1~5)
WIP : pandas DataFrameを使用する
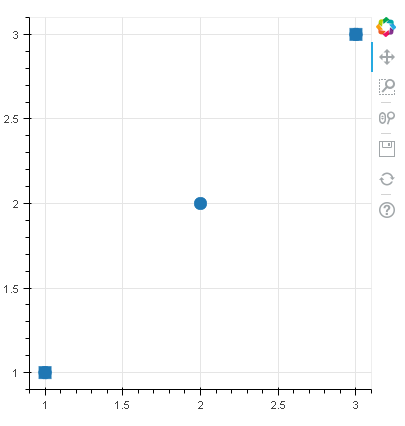
ある点のみプロットさせる
BooleanFilter, IndexFilter, GroupFilter, CustomJsFilterのいずれかを使います。
df = pd.DataFrame({
    "x":[1,2,3],
    "y":[1,2,3],
    "is_special":[True,False,True]
})

output_notebook()
source = ColumnDataSource(df)
view = CDSView(source=source, filters=[BooleanFilter(df["is_special"])])
p= figure(plot_height=400, plot_width=400)
# 通常の点は「丸」でプロット
p.circle(x='x', y='y', source=source, size=12)
# 特別な点は「四角」でプロット
p.square(x='x', y='y', source=source, view=view, size=12)
show(p)
補助目盛線を表示
p = figure(plot_width=400, plot_height=400)
p.circle([2,3, 4],[2,3,4])
p.ygrid.minor_grid_line_color = 'navy'
p.ygrid.minor_grid_line_alpha = 0.1
show(bokeh.layouts.row(p))
https://bokeh.pydata.org/en/latest/docs/user_guide/styling.html#minor-lines 参考
軸ラベルに日付を表示
x_axis_type/y_axis_type引数を指定する。
x_axis_type (Either ( Auto , Enum ( Enumeration(linear, log, datetime, mercator) ) ))
The type of the x-axis. (default: ‘auto’)
df = pd.DataFrame([{"date":datetime.date(2019,5,1), "sales": 100},{"date":datetime.date(2019,6,1), "sales": 200}])
source = ColumnDataSource(data=df)
p = figure(x_axis_label="date", y_axis_label="sales", x_axis_type="datetime")
p.line(x="date", y="sales", source=source)
Tools
Hover Tooltipに日時を表示する。
from bokeh.plotting import ColumnDataSource
from bokeh.models import HoverTool

df = pd.DataFrame([{"x":1, "y":2, "date": datetime.datetime.now()}])

hover_tool = HoverTool(
    tooltips=[
        ( "date", "@date{%F %R}"), # '%Y-%m-%d %H:%M'
    ],
    formatters={
        'date': 'datetime', # 'data'フィールドを'datetime'フォーマットにする
    },
    mode='mouse'
)

source = ColumnDataSource(data=df)
p = figure(tools=[hover_tool], x_axis_label="x", y_axis_label="y")
https://bokeh.pydata.org/en/latest/docs/user_guide/tools.html#formatting-tooltip-fields 参照
figureメソッドにはtooltipsとtoolsというキーワードがあります。違いは以下の通りです。
An optional argument to configure tooltips for the Figure. This argument accepts the same values as the HoverTool.tooltips property. If a hover tool is specified in the tools argument, this value will override that hover tools tooltips value. If no hover tool is specified in the tools argument, then passing tooltips here will cause one to be created and added. (default: None)
https://bokeh.pydata.org/en/latest/docs/reference/plotting.html#bokeh.plotting.figure.figure 引用
細かい話
DataFrameにNaNが含まれていると、プロットされない
p1 = figure(plot_width=400, plot_height=400)
# 2点目にNaNが含まれているので、2点目はプロットされない
p1.circle([2,np.nan, 4],[2,np.nan,4])
show(bokeh.layouts.row(p1))