環境
- Python3.10.2
- bokeh 2.4.2
背景
グラフを描画する際、下図のように目標値などの基準線を引きたいときがあります。
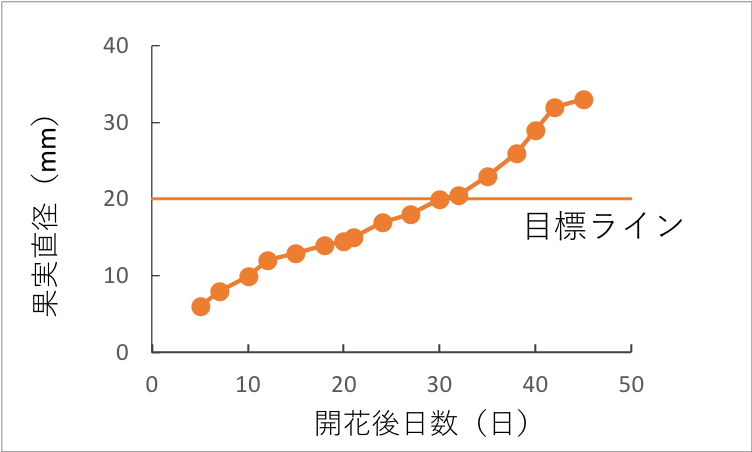
http://drmorich.blog135.fc2.com/blog-entry-281.html 引用
基準線はFigure.line関数よりFigure.ray関数を使った方が便利です。その理由と使い方を記載します。
Figure.ray関数の使い方
Figure.ray関数は半直線を描画します。
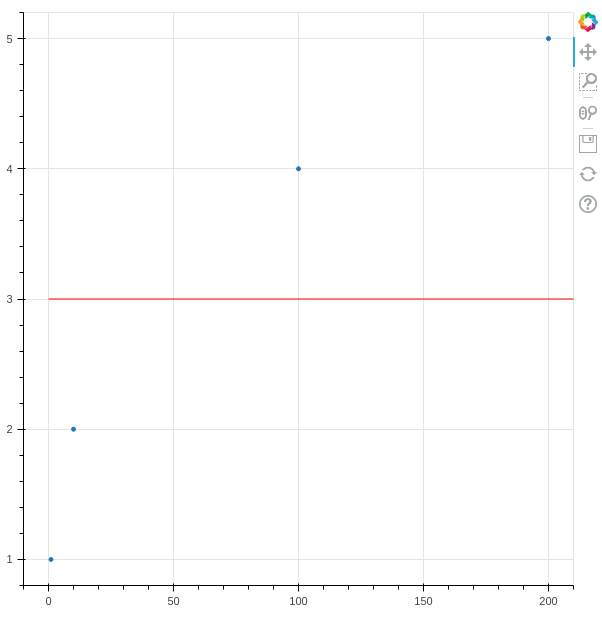
以下のコードを実行すると、y=3の線が描画されます。
plot = figure()
plot.scatter(x=[1, 10, 100,200], y=[1,2,4,5])
plot.ray(x=0, y=3, color="red")
show(plot)
デフォルトでは線の長さは無限です(length引数で指定)。
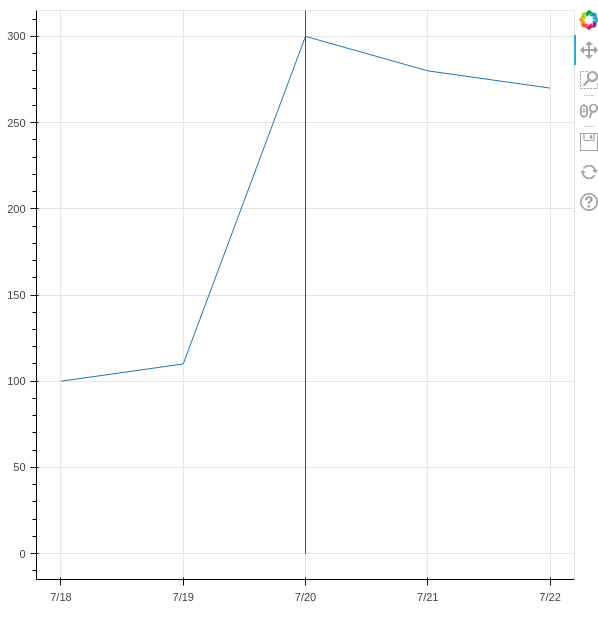
angle引数に角度を指定することも可能です。
dates = [datetime.datetime(2018, 7, 18,0,0,0,0) + datetime.timedelta(days) for days in range(5)]
sales = [100, 110, 300, 280, 270]
plot = figure(x_axis_type="datetime")
plot.line(x=dates, y=sales)
plot.ray(x=datetime.datetime(2018, 7, 20), y=0, angle=math.pi/2, color="red")
show(plot)
詳細な使い方を知りたい方は、User Guideも参照ください。
Figure.ray関数を使うメリット
メリット1:無限の長さの線が引ける
基準線の長さは通常無限です。
Figure.ray関数ではlength引数を指定しなければ、長さが無限の直線(正しくは半直線)が引けます。
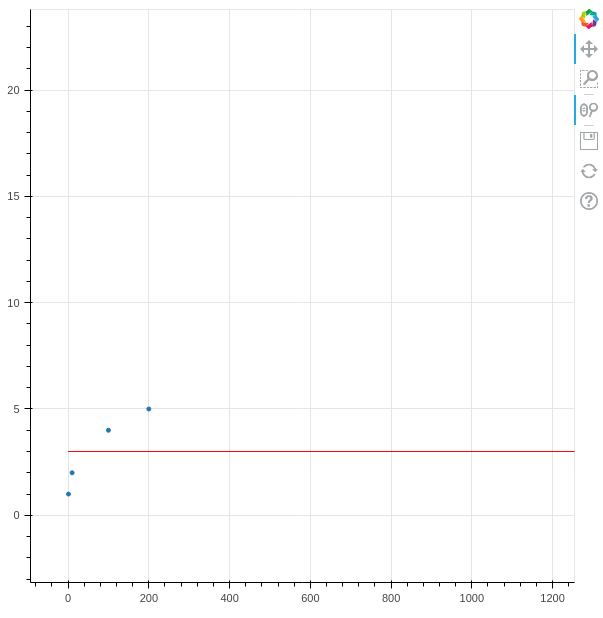
Figure.line関数では必ず2点を指定するので、長さを指定することになります。
メリット2:デフォルトのグラフ範囲にあまり影響しない
デフォルトのグラフ範囲は、描画対象のデータがすべて表示される範囲です。
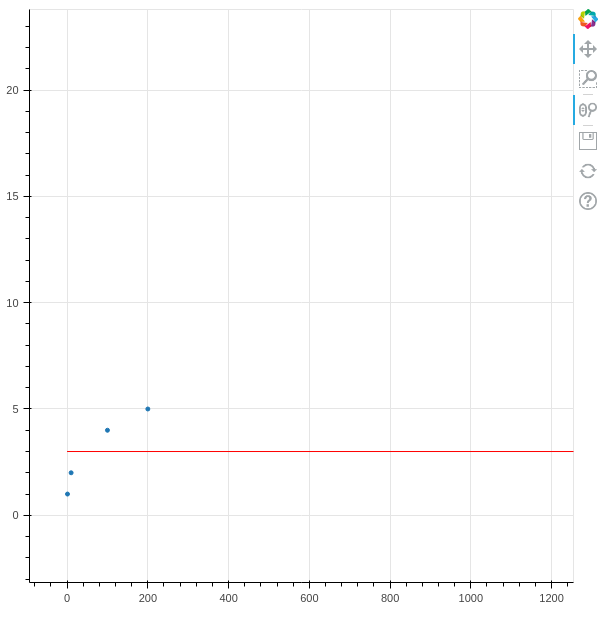
したがって、基準線をFigure.line関数で引くと、図のようにデフォルトのグラフ範囲が広くなりすぎます。
plot = figure()
plot.scatter(x=[1, 10, 100,200], y=[1,2,4,5])
plot.line(x=[0,1000], y=[3,3], color="red")
show(plot)
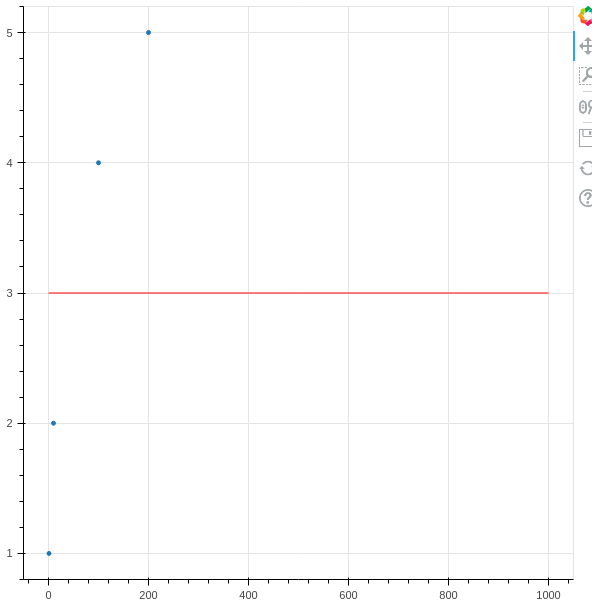
Figure.ray関数では長さを無限にしても、デフォルトのグラフ範囲には影響しません。
ただしFigure.ray関数で引いた線の始点は、デフォルトのグラフ範囲で表示されます。
Figure.ray関数のデメリット
Figure.ray関数のangleの角度はデータ単位でなくでなく画面単位
以下のコードは、傾きが45°の直線を描画します。
plot = figure()
plot.scatter(x=[1, 10, 100,200], y=[1,2,4,5])
plot.ray(x=0, y=0, angle=math.pi/4, color="red")
show(plot)
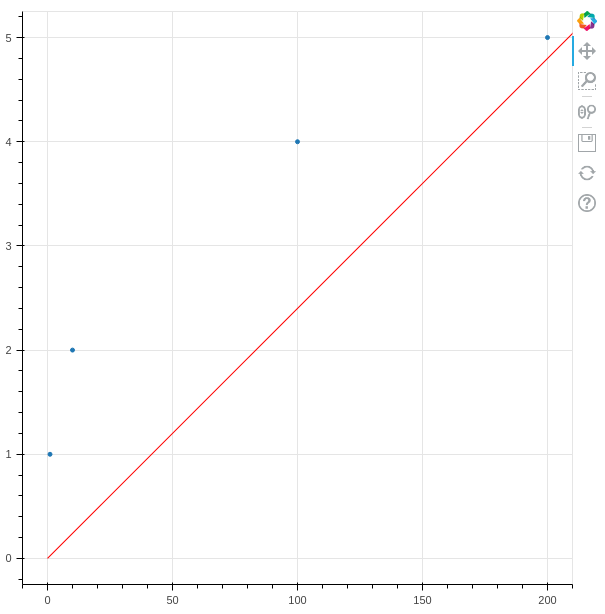
当然ではありますが、angleはデータ単位でなく画面単位です。したがって、y=xのような基準線を引くのは難しいです。
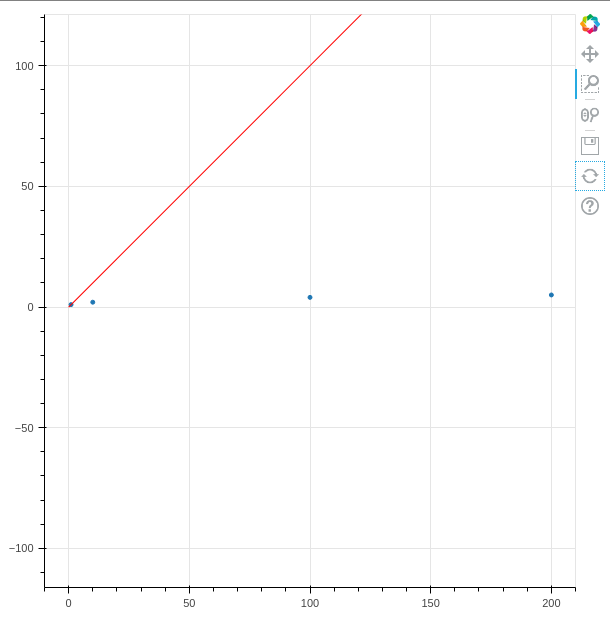
match_aspect=Trueを指定してX軸とY軸のスケールを同じにすればy=xの線は引けますが、決して見やすいグラフではありません。また"Box Zoom"機能を使うとX軸とY軸のスケールが変わってしまい、y=xの線ではなくなります。
This setting only sets the initial plot draw and subsequent resets. It is possible for tools (single axis zoom, unconstrained box zoom) to change the aspect ratio.
plot = figure(match_aspect=True)
plot.scatter(x=[1, 10, 100,200], y=[1,2,4,5])
plot.ray(x=0, y=0, angle=math.pi/4, color="red")
show(plot)
bokehのフォーラムでコアチームメンバに教えてもらいました。
まとめ
- 基準線を水平または垂直に引く場合は、
Figure.ray関数を使うと便利。半直線が引ける。 -
Figure.ray関数のangle引数は画面単位なので、y=xのような傾きのある直線を引くのが難しい。