よく論文にある「複数の遺伝子が五角形として並べてある図」をRで描いてみます.
遺伝子のstartとendとstrandから,五角形を描くのに必要な座標を計算する関数
convertToOperon <- function(x1, x2, strand, heightOfOperon=1, ratioOfTriangle=0.3, y1=1){
  y2 <- y1 + heightOfOperon
  y3 <- y1 + heightOfOperon/2
  if(strand == 1){
    xAngle <- (1-ratioOfTriangle)*(x2-x1)+x1
    x <- c(x1, x1, xAngle, x2, xAngle)
    y <- c(y1, y2, y2, y3, y1)
    return(list(x, y))
  }else{
    xAngle <- ratioOfTriangle*(x2-x1)+x1
    x <- c(x1, xAngle, x2, x2, xAngle)
    y <- c(y3, y2, y2, y1, y1)
    return(list(x, y))
  }
}
たくさんの遺伝子をまとめて描く関数
# 入力は,複数の遺伝子のstart, end, strand, 色を格納したデータフレーム(dat)と,どこから(start)どこまで(end)
plotOperons <- function(dat, start, end, heightOfOperon=0.7, ratioOfTriangle=0.3, y1=1, lwd=2, xlab="[kb]"){
  genome <- c(start, end)
  height <- c(0,3)
  # Define plot space
  plot(genome, height, type = "n", xlab = xlab, ylab="", axes=F)
  axis(1)
  # Draw horizontal line
  lines(c(start, end), c(y1+heightOfOperon/2, y1+heightOfOperon/2), lwd=lwd)
  if(is.factor(dat[,4])){
    dat[,4] <- as.character(dat[,4])
  }
  for(i in 1:nrow(dat)){
    coo <- convertToOperon(dat[i,1], dat[i,2], dat[i,3],
                           heightOfOperon=heightOfOperon,
                           ratioOfTriangle=ratioOfTriangle,
                           y1=y1)
    print(dat[i, 4])
    polygon(coo[[1]], coo[[2]], col=dat[i,4], lwd=lwd)
  }
}
入力データ
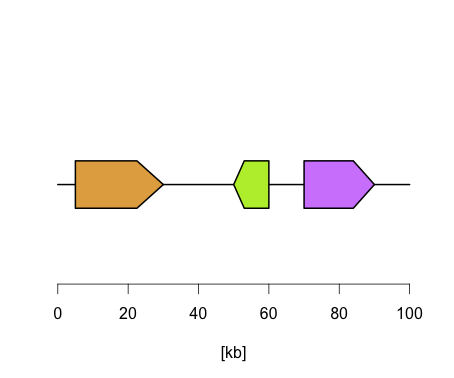
dat <- data.frame(start=c(5, 50, 70),
                  end=c(30, 60, 90),
                  strand=c(1, -1, 1),
                  color=c("orange", "green", "magenta"))
プロット
plotOperons(dat, 0, 100)
追記
こんなのもあるそうです genoPlotR