Python の線形回帰として以前まで scipy.stats.linregress を使っていたが、機能が少なくて使いづらいので statsmodels というのを導入してみた。まだ実質2時間しか使ってないので根本的に何か勘違いしているかもしれない。実質2時間しか使ってないからつれーわー
以下 statsmodels の OLS (ordinary least square; 普通の最小二乗法) の使い方について述べる。公式の資料はこちら
http://statsmodels.sourceforge.net/stable/regression.html
インストール
pip でふつうに。
$ sudo pip install statsmodels
あと以下のコードでは numpy や matplotlib も使うので、無いときはインストールしておく。
$ sudo pip install numpy
$ sudo pip install matplotlib
簡単な例
とりあえず一番簡単な例として、
y = a + bx + \varepsilon
というモデルでの線形回帰を考える。つまり $(x_i,y_i)$ のデータが与えられた時、誤差 $\sum\varepsilon_i^2$ が最小になるようなパラメータ $(a,b)$ の決定を行う。
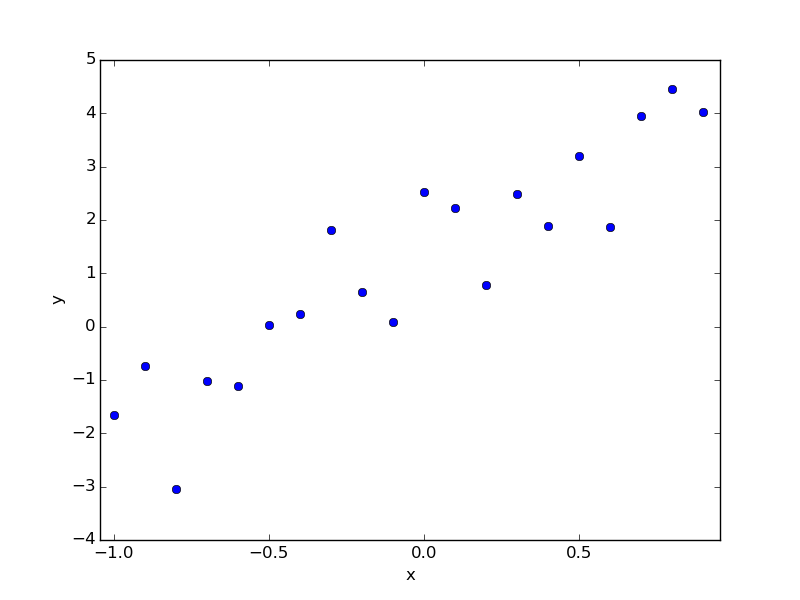
たとえば以下のようなデータがあるとする。これは今自分でつくったデータで、先に答えを行ってしまえば a=1.0, b=3.0 なのだが、それは知らないフリをして回帰で求める。
#      x        y
  -1.000   -1.656
  -0.900   -0.734
  -0.800   -3.036
  -0.700   -1.026
  -0.600   -1.104
  -0.500    0.023
  -0.400    0.246
  -0.300    1.817
  -0.200    0.651
  -0.100    0.082
  -0.000    2.524
   0.100    2.231
   0.200    0.783
   0.300    2.489
   0.400    1.892
   0.500    3.207
   0.600    1.868
   0.700    3.954
   0.800    4.447
   0.900    4.024
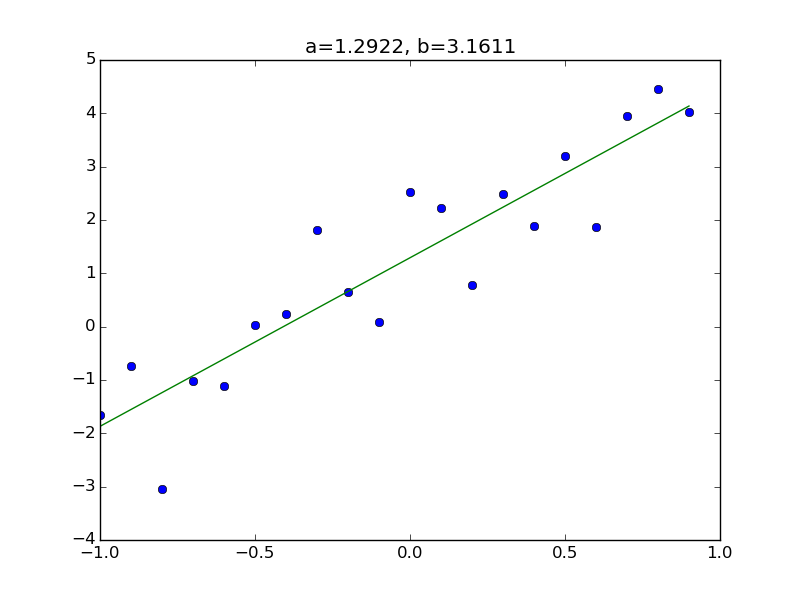
これに対する回帰は以下のようになる。
# coding: utf-8
import numpy as np
import statsmodels.api as sm
import matplotlib.pyplot as plt

# データを読み込む
data = np.loadtxt("data.txt")
x = data.T[0]
y = data.T[1]

# サンプルの数
nsample = x.size

# おまじない (後で解説)
X = np.column_stack((np.repeat(1, nsample), x))

# 回帰実行
model = sm.OLS(y, X)
results = model.fit()

# 結果の概要を表示
print results.summary()

# パラメータの推定値を取得
a, b = results.params

# プロットを表示
plt.plot(x, y, 'o')
plt.plot(x, a+b*x)
plt.text(0, 0, "a={:8.3f}, b={:8.3f}".format(a,b))
plt.show()
実行すると、以下のようなテキストとグラフが表示される。
                            OLS Regression Results
==============================================================================
Dep. Variable:                      y   R-squared:                       0.831
Model:                            OLS   Adj. R-squared:                  0.822
Method:                 Least Squares   F-statistic:                     88.59
Date:                Thu, 25 Dec 2014   Prob (F-statistic):           2.25e-08
Time:                        14:07:16   Log-Likelihood:                -24.450
No. Observations:                  20   AIC:                             52.90
Df Residuals:                      18   BIC:                             54.89
Df Model:                           1
Covariance Type:            nonrobust
==============================================================================
                 coef    std err          t      P>|t|      [95.0% Conf. Int.]
------------------------------------------------------------------------------
const          1.2922      0.194      6.647      0.000         0.884     1.701
x1             3.1611      0.336      9.412      0.000         2.455     3.867
==============================================================================
Omnibus:                        0.801   Durbin-Watson:                   2.495
Prob(Omnibus):                  0.670   Jarque-Bera (JB):                0.653
Skew:                          -0.402   Prob(JB):                        0.721
Kurtosis:                       2.628   Cond. No.                         1.74
==============================================================================

Warnings:
[1] Standard Errors assume that the covariance matrix of the errors is correctly specified.
このようになる。
線形基底関数モデル
先に挙げたモデルは x と y の関係が1次式であったが、人生においてはもっと複雑な x と y の関係を考えたい場合が多い。そこで線形基底関数モデルとかいうのを使うと、わりと多様な x と y の関係が表現できるようになる。
y = \beta_0 + \beta_1 \phi_1(x) + \beta_2\phi_2(x) + \cdots + \beta_{M-1}\phi_{M-1}(x) + \varepsilon
ここで $x,y$ がデータ、$\phi_j(x)$ は既知の関数で、$\beta_j$が求めるべきパラメータである。なおこの式は $\phi_0(x) \equiv 1$ とすることで、簡単に
y = \sum_{j=0}^{M-1} \beta_j\phi_j(x) + \varepsilon
とも書ける。たとえば $M=3, \phi_1(x)=x, \phi_2(x)=x^2$ とすれば、二次関数 $y=\beta_0 + \beta_1x + \beta_2x^2 + \varepsilon$ になる。
statsmodels で回帰を実行する場合、入力する必要があるのはデータ $(x_i, y_i)$ および 既知関数 $\phi_j(x)$ の情報なのだが、関数の情報を直接突っ込むのは厄介なので、$x_i$ と $\phi_j(x_i)$ の情報をまとめた以下のような行列を入力する。(M=3 の場合)
X = \begin{Bmatrix}
\phi_0(x_0) & \phi_1(x_0) & \phi_2(x_0) \\
\phi_0(x_1) & \phi_1(x_1) & \phi_2(x_1) \\
\phi_0(x_2) & \phi_1(x_2) & \phi_2(x_2) \\
& \vdots & \\
\end{Bmatrix}
ここで $\phi_0(x) \equiv 1 $ なので、この行列の1列目はすべて 1 となる。先のコードで「おまじない」と称して np.repeat(1, nsample) という列を加えたのはこのような理由による。
というわけで、この行列Xの作り方さえ変えてやれば、どのようなモデルの線形回帰も可能になる。
やや複雑な例
例として
y = a + bx + cx^2 + \varepsilon
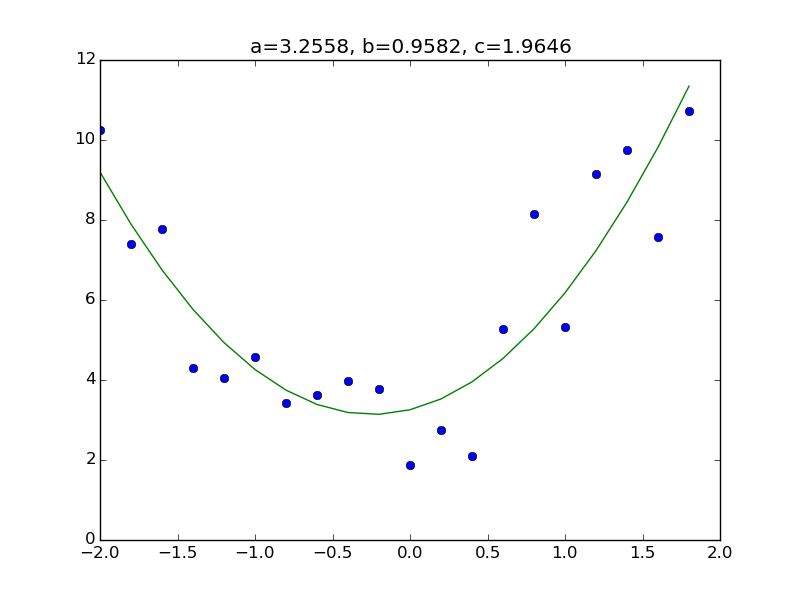
というモデルを考えてみる。やることは前のコードの行列Xの部分に $x^2$ に相当する列を追加するだけである。まずデータセットを用意。例によって先に答えを言うと a=3.0, b=1.0, c=2.0 で作った。
#      x        y
  -2.000   10.260
  -1.800    7.403
  -1.600    7.779
  -1.400    4.310
  -1.200    4.051
  -1.000    4.577
  -0.800    3.416
  -0.600    3.628
  -0.400    3.968
  -0.200    3.780
  -0.000    1.873
   0.200    2.741
   0.400    2.106
   0.600    5.286
   0.800    8.138
   1.000    5.316
   1.200    9.159
   1.400    9.748
   1.600    7.585
   1.800   10.726
コードは以下のとおり。といっても変えたのは行列Xの作成部分と、最後のパラメータの数だけである。
# coding: utf-8
import numpy as np
import statsmodels.api as sm
import matplotlib.pyplot as plt

# データ読み込み
data = np.loadtxt("data.txt")
x = data.T[0]
y = data.T[1]

# サンプルの数
nsample = x.size

# 行列Xの作成
X = np.column_stack((np.repeat(1, nsample), x, x**2))

# 回帰を実行
model = sm.OLS(y, X)
results = model.fit()

# 結果の概要を表示
print results.summary()

# パラメータの推定値を取得
a, b, c = results.params

# グラフで表示
plt.plot(x, y, 'o')
plt.plot(x, a+b*x+c*x**2)
plt.title("a={:.4f}, b={:.4f}, c={:.4f}".format(a,b,c))
plt.show()
その他
statsmodels には OLS (普通の最小二乗法) の他に WLS (重み付き最小二乗法) などもあるので気が向いたら書く


