環境
Google Colab
(Python:3.6.9, astroquery:0.4)
全体の流れ
- skyviewから天体カタログ(fitsファイル)を保存
- fitsファイルを元に銀河画像を作成し保存
- ディレクトリから画像データを順番に読み、ndarray配列に格納
- プロット
コード
fitsファイルの保存
まずは、Vizierで指定のカタログに載っている天体名とその数の取得。
from astroquery.vizier import Vizier
v=Vizier(catalog="J/ApJS/80/531/gxfluxes",columns=["Name","logLx","Bmag","dist","type"],row_limit=-1)
data=v.query_constraints()
sname=data[0]["Name"]
namelist=[]
for one in sname:
  name=one.strip().split()[0]
  name=one.replace("N","NGC").replace("I","IC")
  namelist.append(name)
olist=["HRI","DSS"]
今回の場合、len(namelist)=448なので、448個のの天体があることが分かる。それらの天体のfitsファイルを順に保存していく。
def save(p,name,obs): # save file into fits
    for onep,oneo in zip(p,obs):
        onep.writeto(name+"_"+oneo+".fits",overwrite=True)
from astroquery.skyview import SkyView
path_fits="/content/drive/My Drive/datastore/fits/"
num=int(input("Times of try (for <=448) : "))
filename=[]


for i in range(num):
  name=namelist[i]
  try:
    paths=SkyView.get_images(position=name,survey=olist)
    save(paths,path_fits+name,olist)
    filename.append(name)
    print("Saved  {}".format(name))
  except:
    print("Not found {}".format(name))
ディレクトリからfitsファイルを読み込む。
fitsファイルには300×300のndarray配列の情報があるので、それらを一度1×90000行列にする。他のfitsファイルでも同じ処理をし、その結果を同じndarrayに加えていく。
# ディレクトリ内のfitsファイルの画像データ一次元化し、
# 二次元配列のdataの各行に画像データを格納

path_fits=glob.glob("/content/drive/My Drive/datastore/fits/*_DSS.fits")

N=100
# N=len(path_fits)
h=300
w=300


data = np.empty(h*w*N).reshape(N, h*w)
img_data=np.empty(h*w*N)
for i in range(N):
  dsshdu=fits.open(path_fits[i])[0]
  dsswcs=WCS(dsshdu.header)
  dssdata=dsshdu.data
  img_data=np.array(dssdata)
  data[i] = np.array(dssdata).flatten()
data.shape
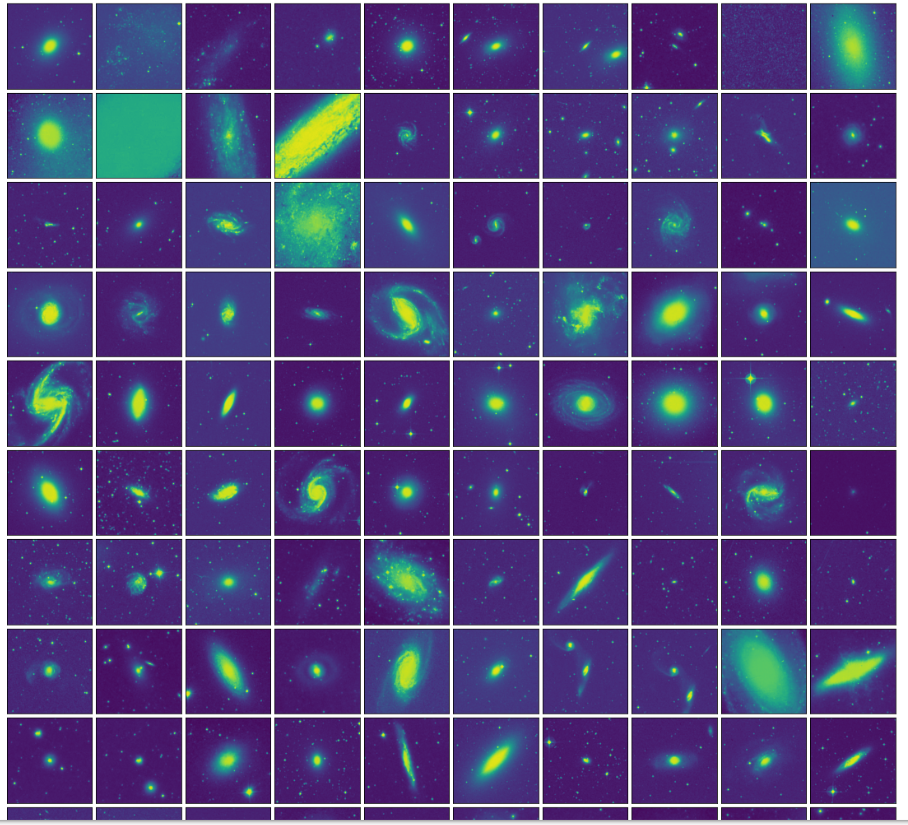
先程フラット化した、画像データを再び、300×300行列にreshapeする。
あとは、普段複数枚の画像を表示するように、plt.add_subplot()の第三引数にfor文を用いて1ずつ増やせば、一枚ずつプロットしてくれる。
data_reshaped=data.reshape(N,h,w)

f=plt.figure(figsize=(15,15))
f.subplots_adjust(left=0,right=1,bottom=0,top=1,hspace=0.05,wspace=0.05)

for i in range(N):
  ax=f.add_subplot(10, 10, i+1, xticks=[], yticks=[])
  ax.imshow(data_reshaped[i], interpolation="bilinear")

plt.show()
