このエントリーは 3-shake Advent Calendar 2022 21日目の記事です。
株式会社スリーシェイクに入社して3ヶ月が経ちました。
今までアウトプット活動をあまりしてこなかったのでこれからはもっとアウトプットに力を入れられたらいいなと思い、Advent Calendarに参加しました。
はじめに
この記事はkube-prometheus-stackを利用してPrometheusやGrafanaなどをKubernetes環境に構築する方法について学んだ時の記録です。
kube-prometheus-stack とは
Prometheusは主にKubernetesクラスターで利用されている監視ツールですが、
kube-prometheus-stackを利用することでPrometheusやGrafanaなどの監視ツールをデプロイすることができます。
kube-prometheus-stackを試す
今回はhelmfileを利用してkube-prometheus-stackでのPrometheus構築を実施します。
以下のディレクトリ構成でhelmfile.yamlとvalues.yamlを用意します。
values.yamlは一旦空で作成します。
├── helmfile.yaml
└── values.yaml
repositories:
  - name: prometheus-community
    url: https://prometheus-community.github.io/helm-charts

releases:
  - name: kube-prometheus-stack
    namespace: prometheus
    chart: prometheus-community/kube-prometheus-stack
    version: 43.1.1
    values:
      - values.yaml
以下のコマンドで上記のhelmfileをデプロイします。
注)初回のデプロイはprometheusのCRDがないので「helmfile apply」を実行するとマニフェストの差分を確認する段階でエラーになります。2回目以降はapplyでも問題ありません。
helmfile sync
コマンドが成功すればPodやサービスがデプロイされていることが確認できます。
$ kubectl get pod -n prometheus
NAME                                                       READY   STATUS    RESTARTS        AGE
alertmanager-kube-prometheus-stack-alertmanager-0          2/2     Running   1 (3m31s ago)   3m32s
kube-prometheus-stack-grafana-c478df4d6-twqfg              3/3     Running   0               3m36s
kube-prometheus-stack-kube-state-metrics-579bf68b5-5j2fm   1/1     Running   0               3m36s
kube-prometheus-stack-operator-64bc8bd9fd-t8d2f            1/1     Running   0               3m36s
kube-prometheus-stack-prometheus-node-exporter-g4blh       1/1     Running   0               3m36s
prometheus-kube-prometheus-stack-prometheus-0              2/2     Running   0               3m32s

$ kubectl get svc -n prometheus
NAME                                             TYPE        CLUSTER-IP      EXTERNAL-IP   PORT(S)
alertmanager-operated                            ClusterIP   None            <none>        9093/TCP,9094/TCP,9094/UDP
kube-prometheus-stack-alertmanager               ClusterIP   172.20.62.13    <none>        9093/TCP
kube-prometheus-stack-grafana                    ClusterIP   172.20.4.11     <none>        80/TCP
kube-prometheus-stack-kube-state-metrics         ClusterIP   172.20.93.43    <none>        8080/TCP
kube-prometheus-stack-operator                   ClusterIP   172.20.35.52    <none>        443/TCP
kube-prometheus-stack-prometheus                 ClusterIP   172.20.158.23   <none>        9090/TCP
kube-prometheus-stack-prometheus-node-exporter   ClusterIP   172.20.75.247   <none>        9100/TCP
prometheus-operated                              ClusterIP   None            <none>        9090/TCP
デプロイが成功したら、PrometheusやGrafanaなどにポートフォワードでアクセスしてみます。
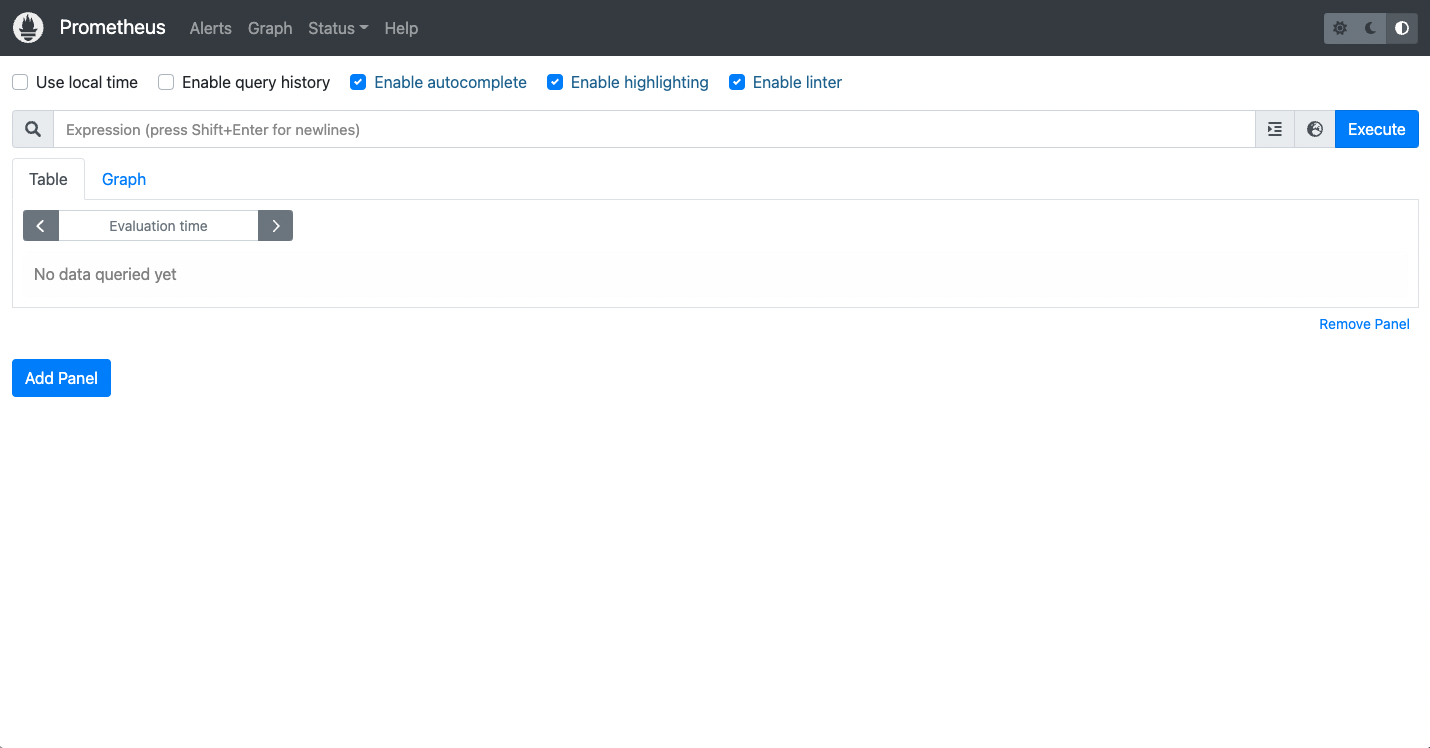
prometheus
kubectl port-forward svc/kube-prometheus-stack-prometheus -n prometheus 9090:9090
http://localhost:9090
でアクセス
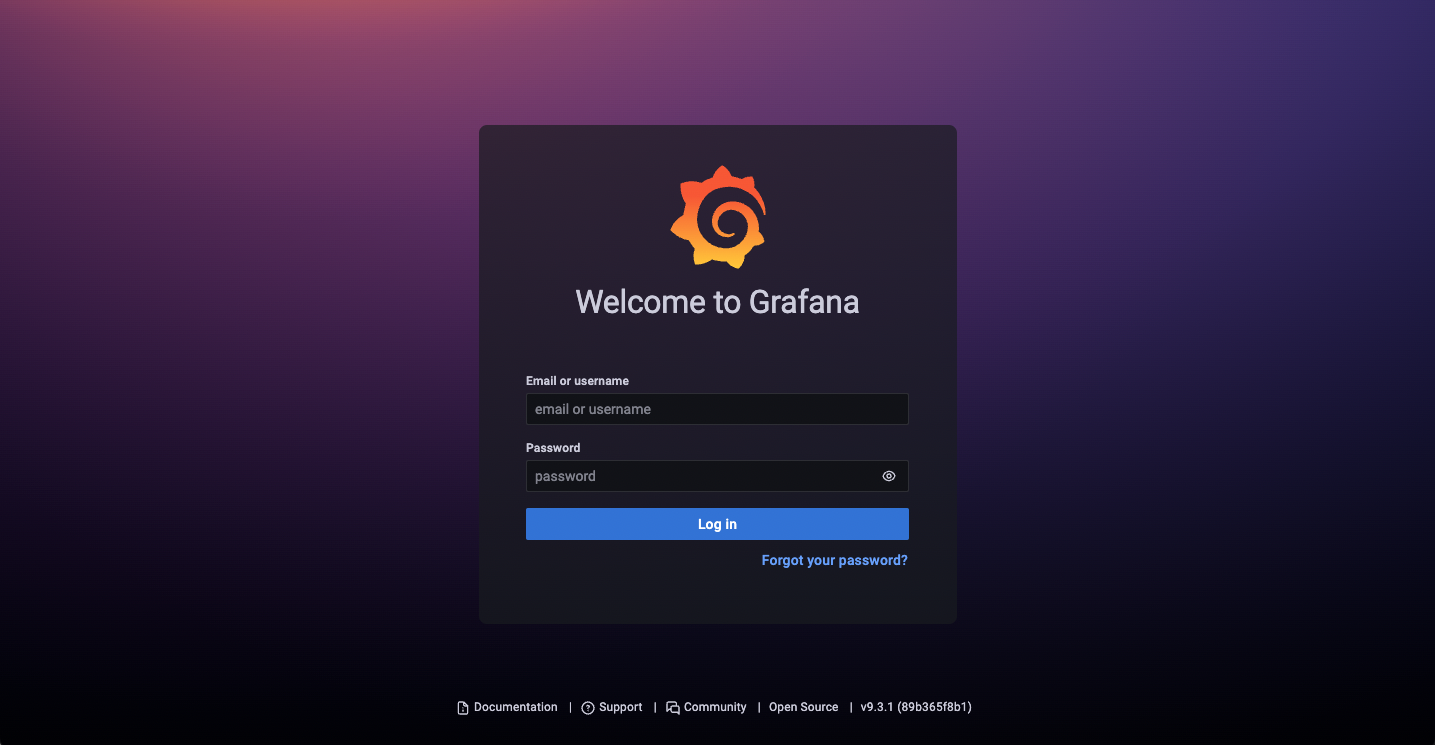
grafana
kubectl port-forward svc/kube-prometheus-stack-grafana -n prometheus 3000:80
http://localhost:3000
でアクセス
username: admin
password: prom-operator
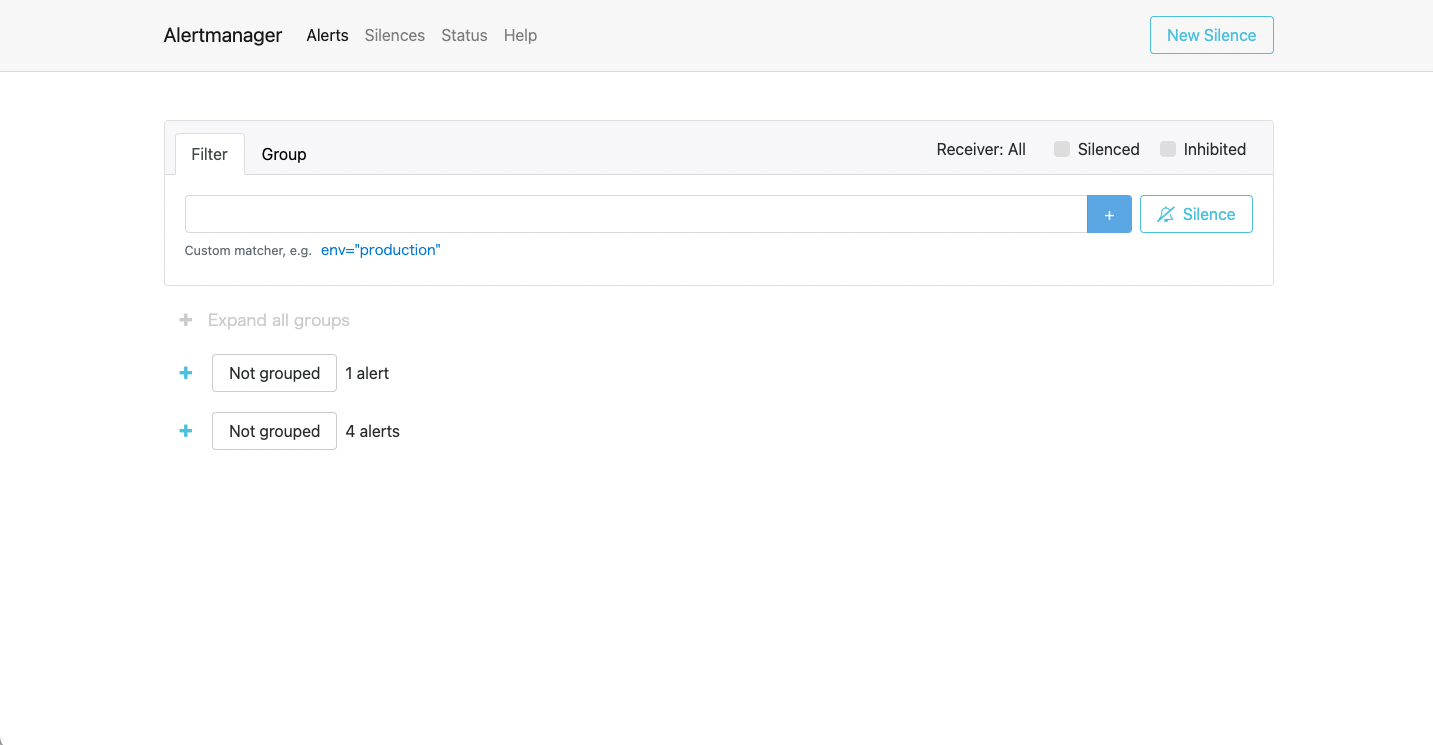
alertmanager
kubectl port-forward svc/kube-prometheus-stack-alertmanager -n prometheus 9093:9093
http://localhost:9093
でアクセス
kube-prometheus-stackの設定
values.yamlでkube-prometheus-stackの設定を管理し、カスタマイズすることができます。
以下のファイルが参考になります。
例えばPrometheusの監視ターゲットを追加したい場合はvalues.yamlに以下のように記載します。
prometheus:
  prometheusSpec:
    additionalScrapeConfigs:
      - job_name: 'prometheus'
        static_configs:
          - targets: ['localhost:9090']
Prometheus→Status→Targetsで新たに作成した「prometheus」が存在することが確認できます。

他にもアラートの設定やPrometheusやGrafanaのIngressの設定などvalues.yamlに記載することで設定を行うことができます。
まとめ
kube-prometheus-stackを利用することで、PrometheusやGrafanaなどを構築することができました。
機会があればkube-prometheus-stackを利用してPrometheusのいろいろな機能を試してみたいと思います。