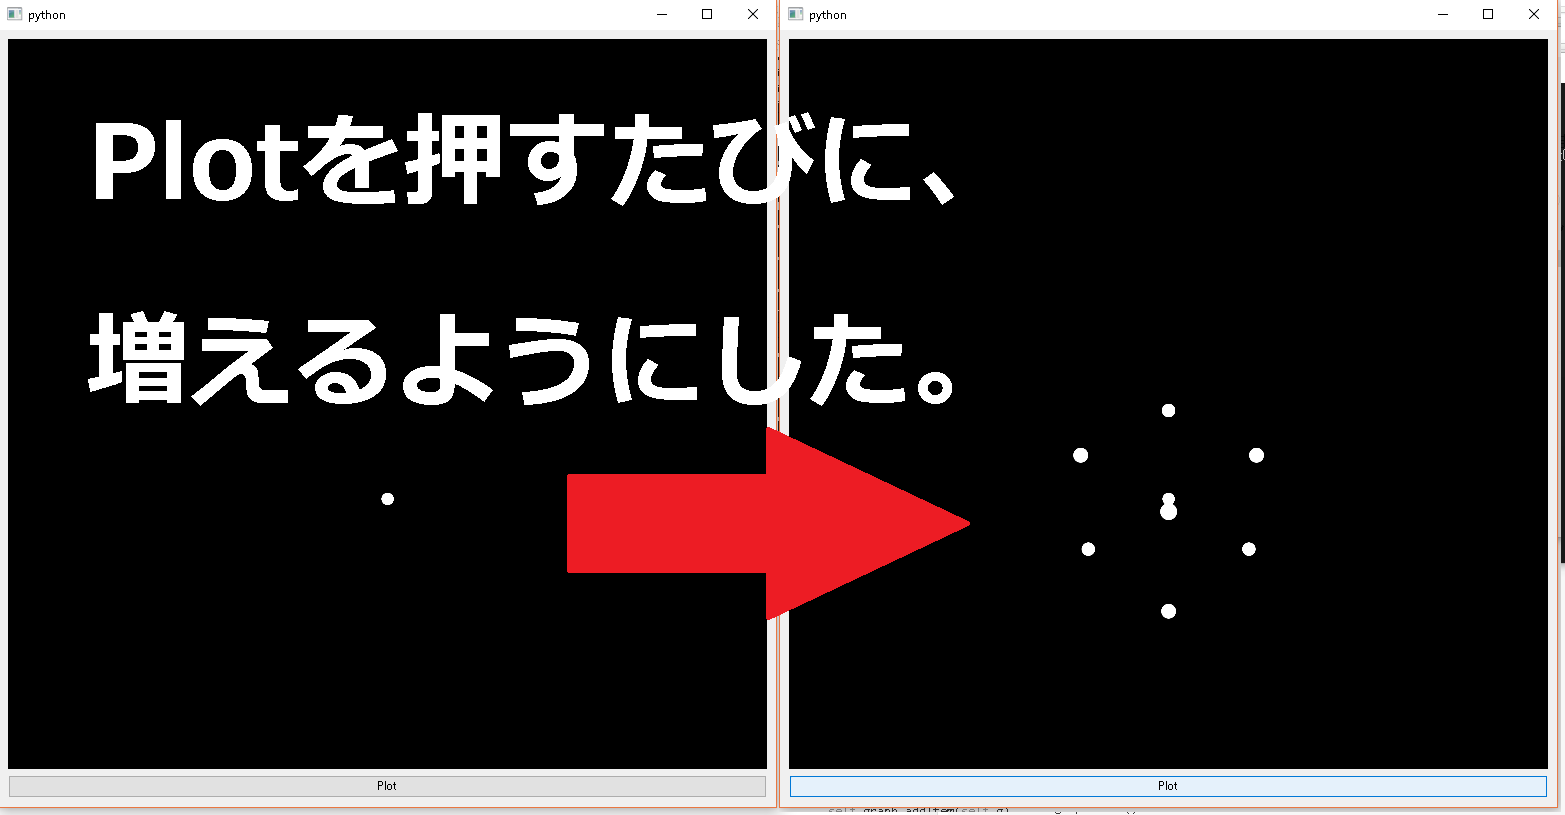
PyQtGraphを使って、3Dプロットの、GUIに挑戦してみました。
まったくやったことがない人にとっては、きつい作業だと思ったので、書き残してみました。
Windowsでやりました。
最初にコードを書いてしまいますが、**実行できない場合、その下を読み進めてください。**多分OpenGL(pyopengl)が入っていないだけかと。
とりあえず
下記コードを、ホームのa.pyとかのファイルとして保存して、 python a.py で実行。
なるべくシンプルな構成でやってみたつもりです。
import sys
from PySide import QtCore, QtGui
import numpy as np
import pyqtgraph.opengl as gl
import pyqtgraph as pg


class Ui_MainWindow(object):
    def setupUi(self, MainWindow):
        MainWindow.setObjectName("MainWindow")
        MainWindow.resize(777, 777)
        self.centralwidget = QtGui.QWidget(MainWindow)
        self.centralwidget.setObjectName("centralwidget")
        MainWindow.setCentralWidget(self.centralwidget)

        self.verticalLayout = QtGui.QVBoxLayout(self.centralwidget)
        self.verticalLayout.setObjectName("verticalLayout")

        self.graph = gl.GLViewWidget(self.centralwidget)
        self.graph.setObjectName("graph")
        self.verticalLayout.addWidget(self.graph)

        self.graph.opts['distance'] = 30
        self.graph.show()
        self.g = gl.GLGridItem()
        self.graph.addItem(self.g)

        self.n=1
        numX, startX, endX = self.n, -1, 1+self.n
        numY, startY, endY = self.n, -1, 1+self.n
        numZ, startZ, endZ = self.n, -1, 1+self.n

        X = np.linspace(startX, endX, numX)
        Y = np.linspace(startY, endY, numY)
        Z = np.linspace(startZ, endZ, numZ)

        #position of scatter in 3D
        pos = np.array([[i,j,k] for i in X for j in Y for k in Z])

        color = (1,1,1,1)
        size = 0.5

        self.scttrPlt = gl.GLScatterPlotItem(pos=pos, size=size, color=color, pxMode=False)
        self.scttrPlt.translate(5,5,0)
        self.graph.addItem(self.scttrPlt)

        self.psbtn = QtGui.QPushButton(self.centralwidget)
        self.psbtn.setObjectName("psbtn")
        self.psbtn.setText("Plot")
        self.verticalLayout.addWidget(self.psbtn)

        QtCore.QObject.connect(self.psbtn, QtCore.SIGNAL("clicked()"), self.plot)

    def plot(self):
        self.n+=1
        numX, startX, endX = self.n, -1, 1+self.n
        numY, startY, endY = self.n, -1, 1+self.n
        numZ, startZ, endZ = self.n, -1, 1+self.n

        X = np.linspace(startX, endX, numX)
        Y = np.linspace(startY, endY, numY)
        Z = np.linspace(startZ, endZ, numZ)

        pos = np.array([[i,j,k] for i in X for j in Y for k in Z])
        color = (1,1,1,1)
        size = 0.5

        self.scttrPlt.setData(pos=pos,color=color,size=size)


pg.setConfigOption('foreground', 'k')
pg.setConfigOption('background', 'w')


class ControlMainWindow(QtGui.QMainWindow):
    def __init__(self, parent=None):
        super(ControlMainWindow, self).__init__(parent)
        self.ui = Ui_MainWindow()
        self.ui.setupUi(self)

if __name__ == "__main__":
    app = QtGui.QApplication(sys.argv)
    mySW = ControlMainWindow()
    mySW.show()
    sys.exit(app.exec_())
必要なもの OpenGL
- OpenGL
- PyQtGraph
- Python
- PySide
これを書いている時点で、OpenGLが何なのか分かっていない。
3DCGソフトを使うと、OpenGLとかいたチェックボックスが出てる位の認識。
python -m pyqtgraph.example
のランチャーから、「3D graphics > Scatter plot」を選んでも、
エラーしか出てこなかった。
下記エラーが出ます。
E:\hoge>python -m pyqtgraph.examples
Using PySide (default graphics system)
Using PySide (default graphics system)
Traceback (most recent call last):
  File "C:\Python27\lib\site-packages\pyqtgraph\examples\GLScatterPlotItem.py", line 11, in <module>
    import pyqtgraph.opengl as gl
  File "C:\Python27\lib\site-packages\pyqtgraph\opengl\__init__.py", line 1, in <module>
    from .GLViewWidget import GLViewWidget
  File "C:\Python27\lib\site-packages\pyqtgraph\opengl\GLViewWidget.py", line 2, in <module>
    from OpenGL.GL import *
ImportError: No module named OpenGL.GL
OpenGL.GLなんて名前のモジュールはありませんよという...
下記をコマンドラインでしましょう。
ちなみに、名前はOpenGLではなく、全て小文字でpyopengl。
pip install pyopengl
E:\hogehoge>pip install pyopengl
Collecting pyopengl
  Downloading PyOpenGL-3.1.0.tar.gz (1.2MB)
    100% |################################| 1.2MB 298kB/s
Building wheels for collected packages: pyopengl
  Running setup.py bdist_wheel for pyopengl ... done
  Stored in directory: C:\Users\yusuke\AppData\Local\pip\Cache\wheels\1c\17\50\f69d63e0a8169fb890f5a167817a73391be85d30e86fd29504
Successfully built pyopengl
Installing collected packages: pyopengl
Successfully installed pyopengl-3.1.0
今度は、出来ました。
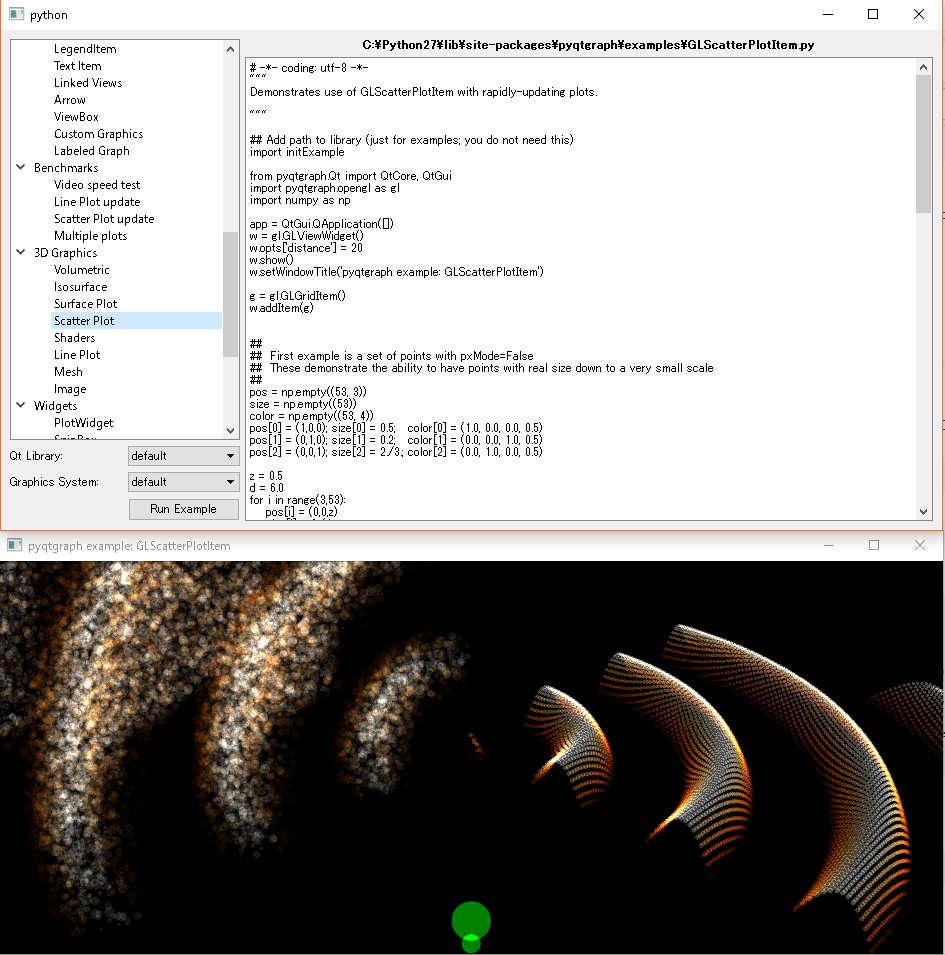
上の画像は、PyQtGraphに付属のサンプルのもの。リアルタイムで動きます。
サンプルのランチャーから、コードも確認できます。
pipは最新版じゃないとダメですよ
python -m pip install --upgrade pip
しましょう。
しなかったので、下記エラーが出た。
E:\hoge>pip install pyopengl
Collecting OpenGL
  Could not find a version that satisfies the requirement OpenGL (from versions: )
No matching distribution found for OpenGL
You are using pip version 8.1.2, however version 9.0.1 is available.
You should consider upgrading via the 'python -m pip install --upgrade pip' command.