0.実現すること
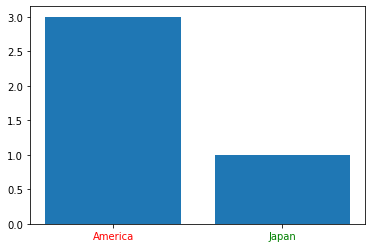
xticklabels(AmericaとかJapanの部分)の色を個別に設定する。
1.Code
example.ipynb
import matplotlib.pyplot as plt

# 描画領域の設定
fig, ax = plt.subplots()

# xticklabelsとyvalueの設定(list)
X = ["America", "Japan"]
Y = [3, 1]

# color 略記でもOK
X_label_colors = ['r', 'green']


plt.bar(X, Y, align="center")

# Xticklabelsとcolorを対応付ける(同数でなければならない)
[t.set_color(i) for (i, t) in zip(X_label_colors, ax.xaxis.get_ticklabels())]

plt.show()
2.メモ
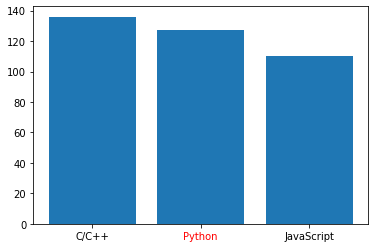
いくつかあるラベルの中で、特に目立たせたいラベルがあるときに使えそう。
example2.ipynb
fig, ax = plt.subplots()

X = ["C/C++", "Python", "JavaScript"]
X_label_colors = ['black', 'red', 'black']
Y = [136, 127,110]

plt.bar(X, Y, align="center")

[t.set_color(i) for (i, t) in zip(X_label_colors, ax.xaxis.get_ticklabels())]

plt.show()