はじめに
OCRするうえで「枠線」は避けて通れません。文書のOCRを進めていると、表の枠線が検出の邪魔をすることがあります。一方で、OCRをする領域を絞り込むために枠線の位置情報を必要とすることもあります。今回は、そんな枠線の情報を取得することを目指します。


対象者
この記事は下記のような人を対象にしています。
- OCRのために枠線の情報を取得したい人
参考元
参考にしたサイト様を以下に示します。書かれている通り、微調整が重要でした。この記事ではその微調整した部分をまとめることができたらと思います。
サンプル画像
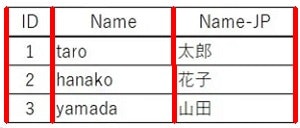
参考元のサンプル画像をスクショし使用しました。そのため、色合いやサイズが微妙に異なります。
(サイズ → 横:300px 縦:128px)
使用ライブラリ
【HoughLinesP】
ハフ変換を用いて、画像内の線分を検出するために利用する関数
lines = cv2.HoughLinesP(img, rho, theta, threshold, minLineLength, maxLineGap)
- img:対象画像。
- rho:xcosθ + ysinθ = ρのρの値。デフォルトは 1。
- theta:ランダムに線を判断するための回転角。大きくすれば複雑な線を認識する。
- threshold:文字などの非線を除外する閾値。
- minLineLength:連なる点の集合の、最小値。この値以上を線としてみなす。
- maxLineGap:どれだけ離れている点(線)を一つの線としてみなすか判断。
サンプルコード
参考元のサンプルでは一部わかりにくい部分がありましたので修正しています。
仮想環境にはあらかじめ opencv-python, numpy, pandas をインストールしておきます。そして作業フォルダ直下にサンプル画像を置いています(sample.jpg)。また、処理結果を out.jpg というファイル名で出力します。
import cv2
import numpy as np
import pandas as pd
from operator import itemgetter

def main():
    target_path = './sample.jpg'
    bgr_img = cv2.imread(target_path)
    img = bgr_img[:,:,0]
    height, width = img.shape
    minlength = width * 0.7
    gap = 0
    judge_img = cv2.bitwise_not(img)

    # 検出しやすくするために二値化
    # th, judge_img = cv2.threshold(judge_img, 128, 255, cv2.THRESH_BINARY)
    th, judge_img = cv2.threshold(judge_img, 64, 255, cv2.THRESH_BINARY)

    # 平行な横線のみ取り扱うため、ふるいにかける
    lines = []
    lines = cv2.HoughLinesP(judge_img, rho=1, theta=np.pi/360, threshold=100, minLineLength=minlength, maxLineGap=gap)

    line_list = []
    for line in lines:
        x1, y1, x2, y2 = line[0]
        # 傾きが threshold_slope px以内の線を横線と判断
        threshold_slope = 3
        if abs(y1 - y2) < threshold_slope:
            whiteline = 3
            lineadd_img = cv2.line(bgr_img, (line[0][0], line[0][1]), (line[0][2], line[0][3]), (0, 0, 255), whiteline)
            x1 = line[0][0]
            y1 = line[0][1]
            x2 = line[0][2]
            y2 = line[0][3]
            line = (x1, y1, x2, y2)
            line_list.append(line)

    # y座標をキーとして並び変え
    line_list.sort(key=itemgetter(1, 0, 2, 3))

    hoz_line = 0
    hoz_line_list = []
    y1 = 0
    for line in line_list:
        judge_y1 = line[1]
        # ほぼ同じ位置の横線は除外
        if abs(judge_y1 - y1) < 2 and hoz_line_list != []:
            y1 = judge_y1
        else:
            y1 = judge_y1
            hoz_line = hoz_line + 1
            hoz_line_list.append(line)

    line_list = pd.DataFrame(hoz_line_list)
    print('line_list_pd')
    print(line_list)
    cv2.imwrite('out.jpg', lineadd_img)

if __name__ == "__main__":
    main()
重要なパラメータはminLineLengthとmaxLineGapです。検出対象が枠線であればminLineLengthは画像の長さの割合で指定するのが無難です。枠線が点線の場合はmaxLineGapの値を適当に5や10など指定します。
また、線の色が薄いと検出に失敗するため2値化します。白背景黒文字のハイコントラストな画像では比較的簡単に二値化できるでしょう。
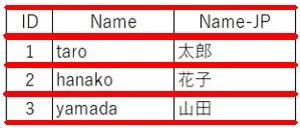
出力結果
(直線の左上x, 直線の左上y, 直線の右下x, 直線の右下y)の値が5本分取れています。
line_list_pd
   0    1    2    3
0  6    7  295    7
1  5   35  295   35
2  6   64  295   64
3  5   93  295   93
4  6  122  295  122
おわりに
画像から横線を検出する方法についてまとめました。線が邪魔になるようであれば白で塗りつぶすなどの後処理が可能です。また、一番上の線と一番下の線の間のみOCRを行うなどの領域の指定も可能です。
おまけ
同様の方法で縦線も検出しました。gapを調整しないと上手く検出できませんでした。
import cv2
import numpy as np
import pandas as pd
from operator import itemgetter

def main():
    target_path = './sample.jpg'
    bgr_img = cv2.imread(target_path)
    img = bgr_img[:,:,0]
    height, width = img.shape
    minlength = height * 0.7
    gap = 5
    judge_img = cv2.bitwise_not(img)

    # 検出しやすくするために二値化
    # th, judge_img = cv2.threshold(judge_img, 128, 255, cv2.THRESH_BINARY)
    th, judge_img = cv2.threshold(judge_img, 64, 255, cv2.THRESH_BINARY)

    lines = []
    lines = cv2.HoughLinesP(judge_img, rho=1, theta=np.pi/360, threshold=100, minLineLength=minlength, maxLineGap=gap)

    line_list = []
    for line in lines:
        x1, y1, x2, y2 = line[0]
        print(x1, y1, x2, y2)
        # 傾きが threshold_slope px以内の線を縦線と判断
        threshold_slope = 3
        if abs(x1 - x2) < threshold_slope:
            whiteline = 3
            lineadd_img = cv2.line(bgr_img, (line[0][0], line[0][1]), (line[0][2], line[0][3]), (0, 0, 255), whiteline)
            x1 = line[0][0]
            y1 = line[0][1]
            x2 = line[0][2]
            y2 = line[0][3]
            line = (x1, y1, x2, y2)
            line_list.append(line)

    # y座標をキーとして並び変え(今回は必要ない)
    # line_list.sort(key=itemgetter(0, 1, 2, 3))

    ver_line = 0
    ver_line_list = []
    x1 = 0
    for line in line_list:
        judge_x1 = line[0]
        # ほぼ同じ位置の縦線は除外
        if abs(judge_x1 - x1) < 2 and ver_line_list != []:
            x1 = judge_x1
        else:
            x1 = judge_x1
            ver_line = ver_line + 1
            ver_line_list.append(line)

    line_list = pd.DataFrame(ver_line_list)
    print('line_list_pd')
    print(line_list)
    cv2.imwrite('out_ver.jpg', lineadd_img)

if __name__ == "__main__":
    main()
line_list_pd
     0    1    2    3
0  173    8  174  121
1  295  121  295    8
2   52  121   52    8
3    6  121    6    8