2019/11/25追記
matplotlib3.1.2がリリースされて、解決されてました!
バージョンを上げましょう〜
はじまり
セル内に数値を表示してくれるannotが使いたくて、matplotlibからseabornに移ろうと思いました。
以下のコードで確認をしていたところ…
%matplotlib inline
import matplotlib.pyplot as plt
import seaborn as sns
import numpy as np

flights_long = sns.load_dataset("flights")
flights = flights_long.pivot("month", "year", "passengers")

fig, ax = plt.subplots(figsize=(6, 6))
sns.heatmap(flights, annot=True, fmt="d", linewidths=.5, ax=ax, square=True)
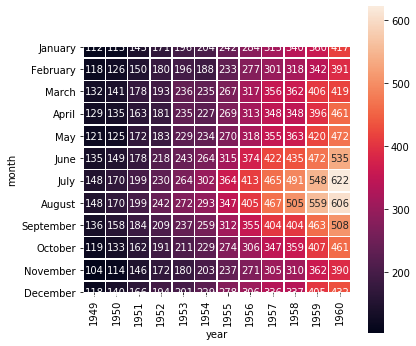
y軸の端が足りなくて、数値が切れてしまいました。
結論
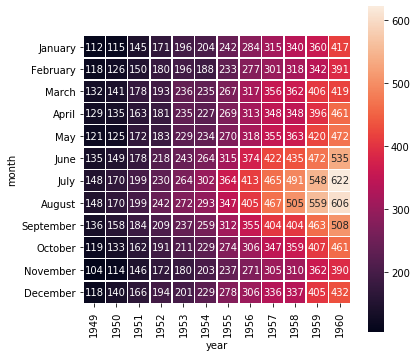
調べてみてもいい答えを探し当てることができなかったので、応急処置としてylimを定義することで回避しました。
追加したのは、最後の1行のみです。
一般的な表記として、ax.set_ylim(${y軸の要素数}, 0)とすれば、切れるのは回避できます。
%matplotlib inline
import matplotlib.pyplot as plt
import seaborn as sns
import numpy as np

flights_long = sns.load_dataset("flights")
flights = flights_long.pivot("month", "year", "passengers")

fig, ax = plt.subplots(figsize=(6, 6))
sns.heatmap(flights, annot=True, fmt="d", linewidths=.5, ax=ax, square=True)
ax.set_ylim(len(flights), 0)

