はじめに
IoTのセンサーからのデータを、Raspberry Piで受けて、データベース経由で可視化する試みを、これまで、node-RED → SQLite → node-REDダッシュボードで行ってきましたが、なかなか思うようなダッシュボードでの可視化が出来ませんでした。少し気の利いたグラフ(時刻範囲の指定とか、平均処理とか)をしようとすると、いきなり、JavaScriptのコードや、SQLを色々書いて加工しないといけない羽目になってしまい、プログラムレスを謳っているnode-REDの使い方としては、ちぐはぐで、いまいちだなぁ・・と感じていました。
ネットをいろいろ調べてみると、influxDBという時系列データベースに格納し、grafanaとか、chronografというツールを活用すると、このあたりの格納から可視化が、もっと容易に出来そう・・な記事があちこちにありましたので、試してみる事にしました。
考えている構成は、センサー → node-RED → influxDBノード → influxDB → chronografで可視化です。後々、grafanaをインストールして、更に高度な可視化に挑戦しようと思いますが、まずは chronografで入門編として実施してみることにしました。
influxdbのインストール
インストールする対象は、Raspberry Pi 3B + です。参考にさせて頂いた記事は、
- Installing InfluxDB to the Raspberry Pi
- Running the TICK Stack on a Raspberry Pi
- 【Iot自宅環境下準備】センシングしたデータをラズパイで保存するデータベースInfluxDBの設定
- Installing InfluxDB & Grafana on Raspberry Pi
などです。
インストールの前に、sudo apt updateと sudo apt upgradeを実施しておきます。
OSバージョンの確認
OSのバージョンを確認しておきます。私の環境では、10の busterになります。リポジトリを設定するときにOSバージョンに対応した物をダウンロードするために必要らしいです。
pi@rpi3bp001:~ $ cat /etc/os-release
PRETTY_NAME="Raspbian GNU/Linux 10 (buster)"
NAME="Raspbian GNU/Linux"
VERSION_ID="10"
VERSION="10 (buster)"
VERSION_CODENAME=buster
ID=raspbian
ID_LIKE=debian
HOME_URL="http://www.raspbian.org/"
SUPPORT_URL="http://www.raspbian.org/RaspbianForums"
BUG_REPORT_URL="http://www.raspbian.org/RaspbianBugs"
pi@rpi3bp001:~ $
リポジトリのGPGキーを取得します。
$ curl -sL https://repos.influxdata.com/influxdb.key | sudo apt-key add -
OK
リポジトリを追加します。
ここで、先ほど確認した OSのバージョン名 (buster)が使われます。
$ echo "deb https://repos.influxdata.com/debian buster stable" | sudo tee /etc/apt/sources.list.d/influxdb.list
結果として、/etc/apt/sources.list.d/influxdb.listというファイルに、この echoの内容が書き込まれます。
追加したリポジトリに関連するupdateを実行します。
influxdbの busterに関連するパッケージを取得します。
$ sudo apt update
influxdbをインストールします。
$ sudo apt install influxdb
influxdbを起動します。
influxdbのサービスを起動します。
$ sudo systemctl start influxdb.service
ちなみに、停止、再起動は以下のとおり。
$ sudo systemctl stop influxdb.service
$ sudo systemctl restart influxdb
自動起動の設定
ラズパイ起動時に自動的に、influxdbのサービスが起動するように設定します。
$ sudo systemctl enable influxdb.service
influxコマンドが動くか確認
試しに、influxコマンドが動作するかを確認します。influxコマンドのプロンプトから終了するのは、'quit'です。
$ influx
Connected to http://localhost:8086 version 1.8.0
InfluxDB shell version: 1.8.0
> help
Usage:
        connect <host:port>   connects to another node specified by host:port
        auth                  prompts for username and password
        pretty                toggles pretty print for the json format
        chunked               turns on chunked responses from server
        chunk size <size>     sets the size of the chunked responses.  Set to 0 to reset to the default chunked size
        use <db_name>         sets current database
        format <format>       specifies the format of the server responses: json, csv, or column
        precision <format>    specifies the format of the timestamp: rfc3339, h, m, s, ms, u or ns
        consistency <level>   sets write consistency level: any, one, quorum, or all
        history               displays command history
        settings              outputs the current settings for the shell
        clear                 clears settings such as database or retention policy.  run 'clear' for help
        exit/quit/ctrl+d      quits the influx shell

        show databases        show database names
        show series           show series information
        show measurements     show measurement information
        show tag keys         show tag key information
        show field keys       show field key information

        A full list of influxql commands can be found at:
        https://docs.influxdata.com/influxdb/latest/query_language/spec/
> quit
$
influxdbが正しく動作しているかを確認します。大丈夫そうです。
$ systemctl status influxdb
● influxdb.service - InfluxDB is an open-source, distributed, time series databa
   Loaded: loaded (/lib/systemd/system/influxdb.service; enabled; vendor preset:
   Active: active (running) since Thu 2020-05-28 22:16:31 JST; 6min ago
     Docs: https://docs.influxdata.com/influxdb/
 Main PID: 24902 (influxd)
    Tasks: 14 (limit: 2200)
   Memory: 8.9M
   CGroup: /system.slice/influxdb.service
           mq24902 /usr/bin/influxd -config /etc/influxdb/influxdb.conf

 5月 28 22:16:31 rpi3bp001 influxd[24902]: ts=2020-05-28T13:16:31.868023Z lvl=in
 5月 28 22:16:31 rpi3bp001 influxd[24902]: ts=2020-05-28T13:16:31.868412Z lvl=in
 5月 28 22:16:31 rpi3bp001 influxd[24902]: ts=2020-05-28T13:16:31.868570Z lvl=in
 5月 28 22:16:31 rpi3bp001 influxd[24902]: ts=2020-05-28T13:16:31.869286Z lvl=in
 5月 28 22:16:31 rpi3bp001 influxd[24902]: ts=2020-05-28T13:16:31.869033Z lvl=in
 5月 28 22:19:13 rpi3bp001 influxd[24902]: [httpd] ::1 - - [28/May/2020:22:19:13
 5月 28 22:19:15 rpi3bp001 influxd[24902]: [httpd] ::1 - - [28/May/2020:22:19:15 ・・・以下略
データベースの一覧を確認します。まだ何も作っていないので、_internalのみ存在します。
$ curl http://localhost:8086/query --data-urlencode "q=SHOW DATABASES"
{"results":[{"statement_id":0,"series":[{"name":"databases","columns":["name"],"values":[["_internal"]]}]}]}
データベースの作成
データベースを作成します。本来なら、アクセス権を制限するためのユーザー作成や設定が必要ですが、とりあえずセキュリティーは忘れて、"influx_iot01"というデータベースを作ってみます。
$ influx
Connected to http://localhost:8086 version 1.8.0
InfluxDB shell version: 1.8.0
> create database influx_iot01
> use influx_iot01
Using database influx_iot01
> show databases
name: databases
name
----
_internal
influx_iot01
>
確かに、influx_iot01というデータベースが作成されています・・・が・・・、
さて、ファイルはどこに作成されたのでしょう? ・・・不明・・・。
node-REDからデータを挿入してみる。
node-REDの influxdbノードに、作成したデータベース名を設定し、新規のテーブル(influxdbでは、measurementと呼ぶらしい)に対して、適当に値を挿入してみます。
node-REDのフロー
node-REDに influxdbのノードを追加した後で、フローに追加してみます。
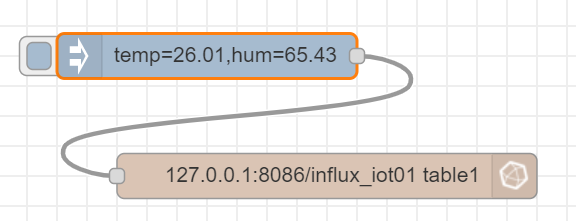
[{"id":"1ba3f2c4.2b7ddd","type":"influxdb out","z":"c851379d.611068","influxdb":"e2d98b52.c73258","name":"","measurement":"table1","precision":"","retentionPolicy":"","x":260,"y":840,"wires":[]},{"id":"7977717.6851c9","type":"inject","z":"c851379d.611068","name":"","topic":"","payload":"temp=26.01,hum=65.43","payloadType":"str","repeat":"","crontab":"","once":false,"onceDelay":0.1,"x":180,"y":760,"wires":[["1ba3f2c4.2b7ddd"]]},{"id":"e2d98b52.c73258","type":"influxdb","z":"","hostname":"127.0.0.1","port":"8086","protocol":"http","database":"influx_iot01","name":"","usetls":false,"tls":""}]
injectノードで、適当に温度と湿度を二つほど、書き込んでみました。事前にテーブル(measurement)を作成しておく必要はなく、勝手に作られます。
挿入されたか確認
influxコマンドから、select * from table1 で挿入したデータを確認できます。
$ influx
Connected to http://localhost:8086 version 1.8.0
InfluxDB shell version: 1.8.0
> use influx_iot01
Using database influx_iot01
> select * from table1
name: table1
time                value
----                -----
1590674119307263902 temp=25.85,hum=98.5245
1590674375850107875 temp=26.01,hum=65.43
>
これで、node-RED上に集められた各種のデータを、influxdbのテーブル(measurement)に格納するための基本は確認できました。さすがに、時系列データベースというだけあって、タイムスタンプが自動的にキーとして書き込まれています。
間違い・・・
と思ったのは間違いでした。"value"の中に、tempも humも文字列として入っていて、それぞれが別のフィールドに入っていません。下記の確認でも、それが分かります。挿入の仕方がよろしく無いようです。tempと humをそれぞれ、別のフィールドとして挿入するには、どうしたらいいのでしょう。
$ curl -G 'http://localhost:8086/query?db=influx_iot01&pretty=tru
e' --data-urlencode 'q=SELECT * FROM table1'
{
    "results": [
        {
            "statement_id": 0,
            "series": [
                {
                    "name": "table1",
                    "columns": [
                        "time",
                        "value"
                    ],
                    "values": [
                        [
                            "2020-05-28T14:39:37.288066876Z",
                            "temp=17.92,hum=69.0800\r\n"
                        ],
                        [
                            "2020-05-28T14:44:34.151296444Z",
                            "temp=17.84,hum=69.4800\r\n"
                        ],
                        [
                            "2020-05-28T14:49:31.001973892Z",
                            "temp=17.84,hum=68.6800\r\n"
                        ]
                    ]
                }
            ]
        }
    ]
}
$
node-REDの、influxdbノードの説明に、
"If msg.payload is a string, number, or boolean, it will be written as a single value to the specified measurement (called value).
If msg.payload is an object containing multiple properties, the fields will be written to the measurement."
という説明がありました。なるほど。文字列で渡すとだめで、objectとして渡す必要があるとの事。
var x = msg.payload.split(',');
if (x.length == 3) {
    msg.payload = {
        "temp": parseFloat(x[1]),
        "hum":parseFloat(x[2])
    }
    return msg;
}
のように、json objectとして渡す事で、正常にfloatとして、別々のフィールドとして格納することができました。
フローは以下のとおり。
[{"id":"1ba3f2c4.2b7ddd","type":"influxdb out","z":"c851379d.611068","influxdb":"e2d98b52.c73258","name":"","measurement":"table1","precision":"","retentionPolicy":"","x":380,"y":820,"wires":[]},{"id":"7977717.6851c9","type":"inject","z":"c851379d.611068","name":"","topic":"","payload":"{\"temp\":26.01,\"hum\":65.43}","payloadType":"json","repeat":"","crontab":"","once":false,"onceDelay":0.1,"x":150,"y":820,"wires":[["1ba3f2c4.2b7ddd"]]},{"id":"b20344e1.24f428","type":"function","z":"c851379d.611068","name":"温度・湿度分離","func":"var x = msg.payload.split(',');\nif (x.length == 3) {\n msg.payload = {\n \"temp\": parseFloat(x[1]),\n \"hum\":parseFloat(x[2])\n }\n return msg;\n}\n","outputs":1,"noerr":0,"x":220,"y":740,"wires":[["50ca706a.0b7a8","1ba3f2c4.2b7ddd"]]},{"id":"50ca706a.0b7a8","type":"debug","z":"c851379d.611068","name":"","active":true,"tosidebar":true,"console":false,"tostatus":false,"complete":"false","x":420,"y":740,"wires":[]},{"id":"e2d98b52.c73258","type":"influxdb","z":"","hostname":"127.0.0.1","port":"8086","protocol":"http","database":"influx_iot01","name":"","usetls":false,"tls":""}]
measurement (table1)の中味を確認すると、以下の通り数値として温度と湿度が記録されました。めでたし、めでたし。
> select * from table1
name: table1
time                hum   temp
----                ---   ----
1590678854985666143 70.22 17.7
1590679151614186158 70.42 17.58
>
アクセス制限
アクセス制限が無いと、セキュリティー上、危険ですが、とりあえず、自宅内のローカルラズパイサーバーという事で、しばらくこのまま制限無しで実験することにします。
chronografのインストール
可視化のため、chronografを raspberry piにインストールします。
$sudo apt install chronograf
作成したデータベースに接続します。
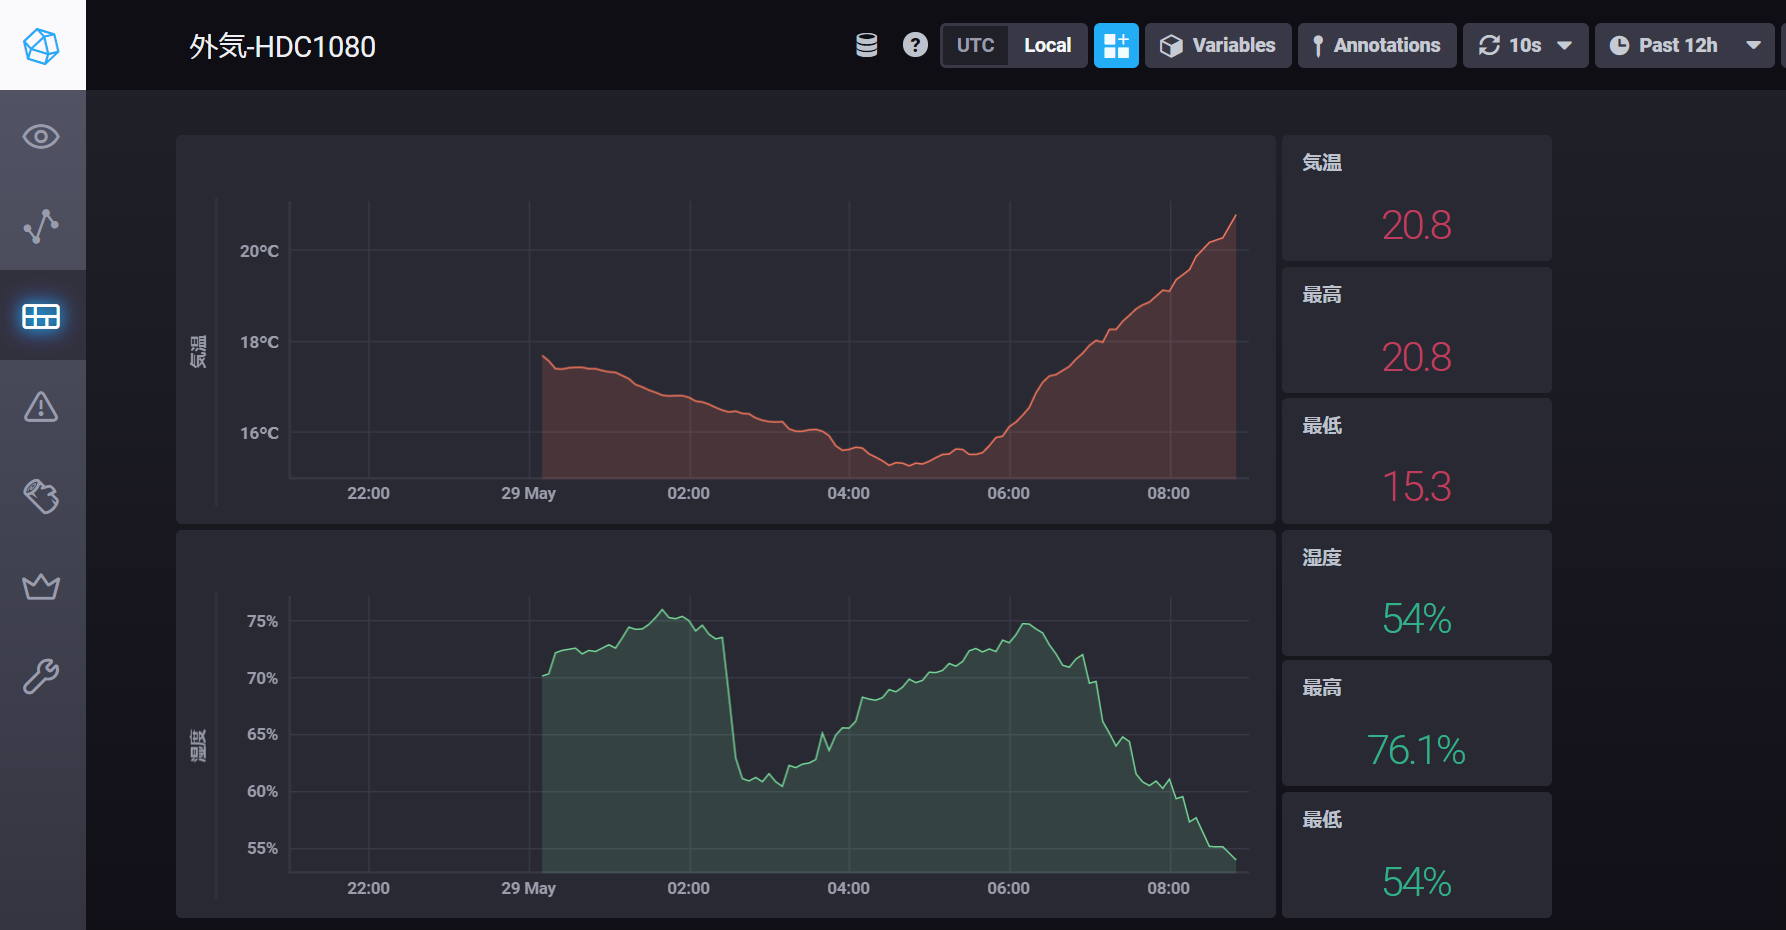
chronografによる可視化
Raspberry piのIPアドレスのポート 8888を開き、作成したデータベースに接続し、いくつかの設定を行い以下のDashboardが簡単に出来ることを確認しました。
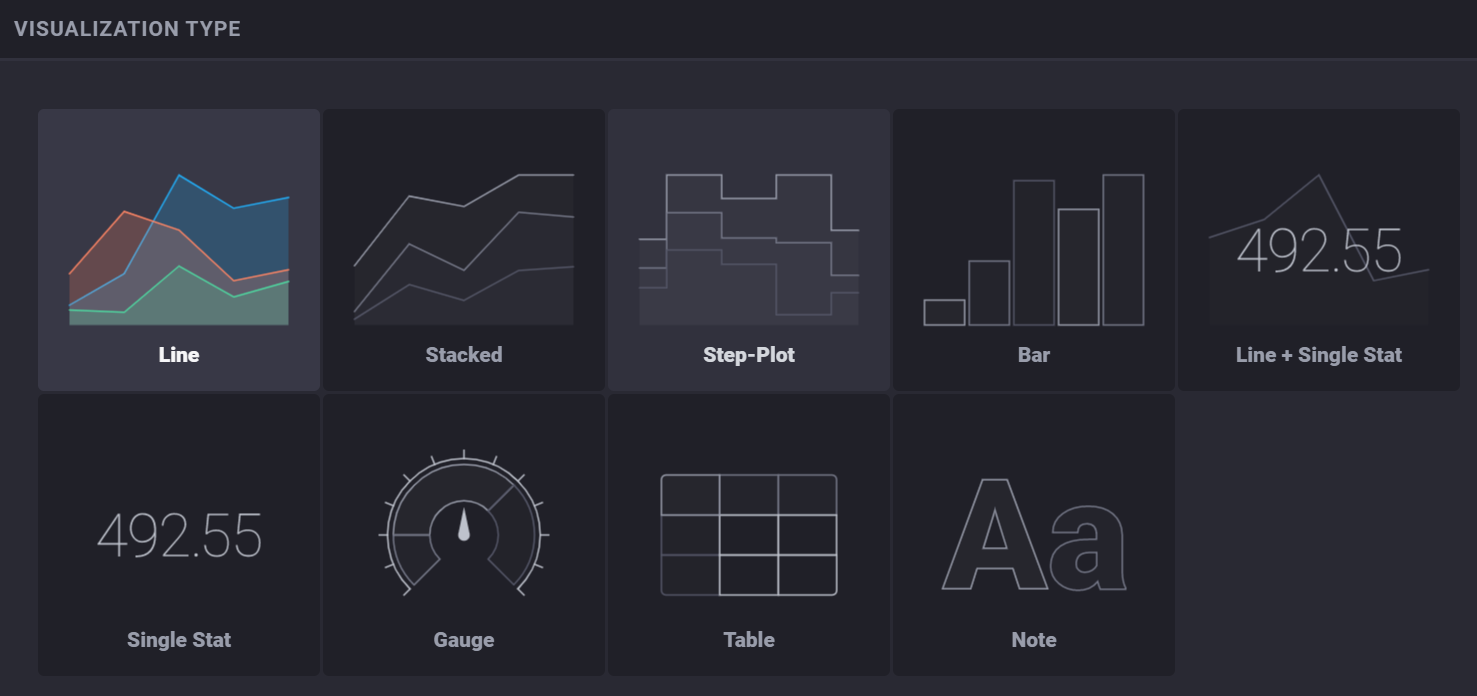
グラフ設定のオプションいろいろ
チャートの種類はこれだけ。
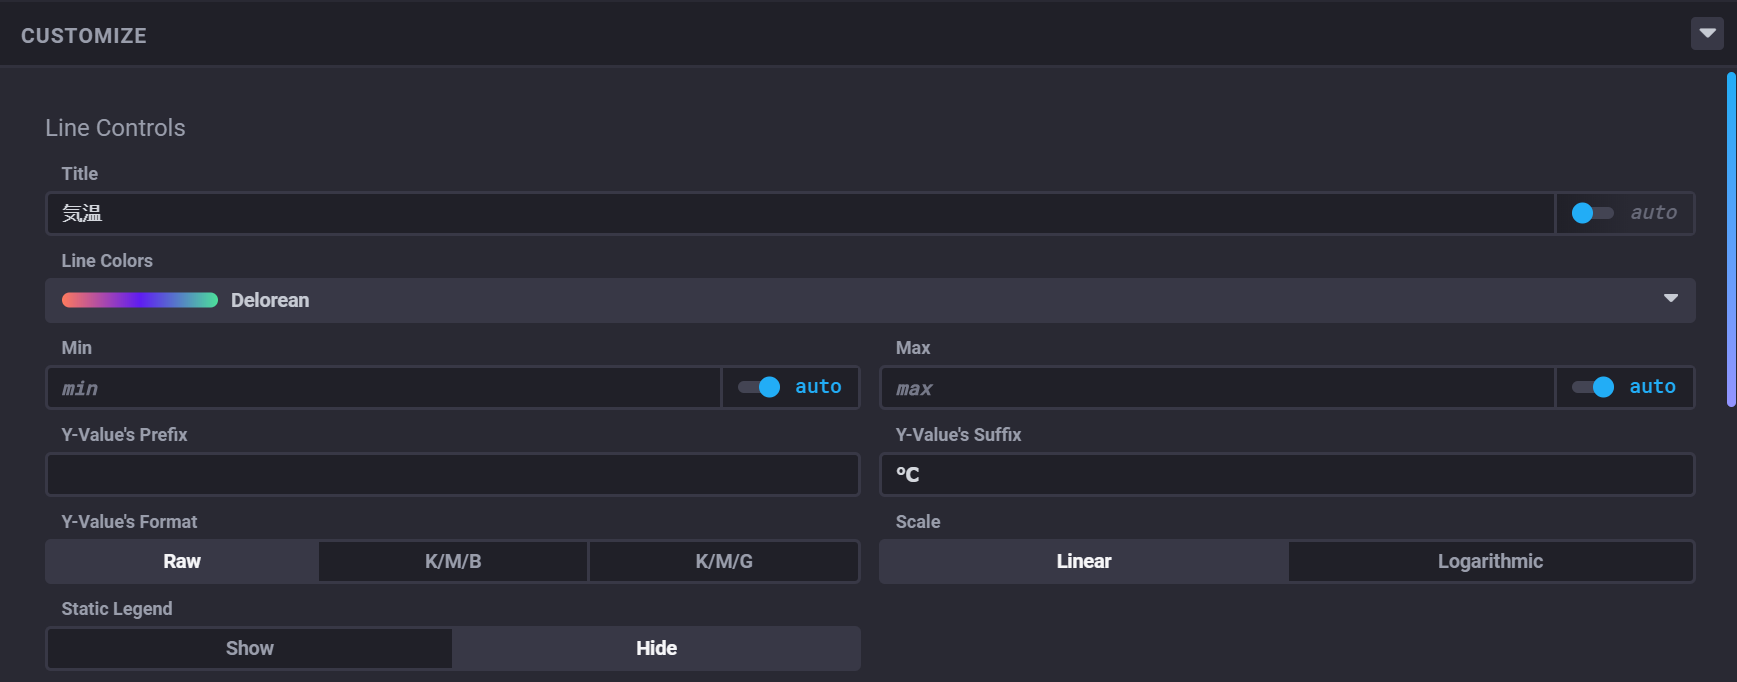
チャート毎の可視化設定(色とか)
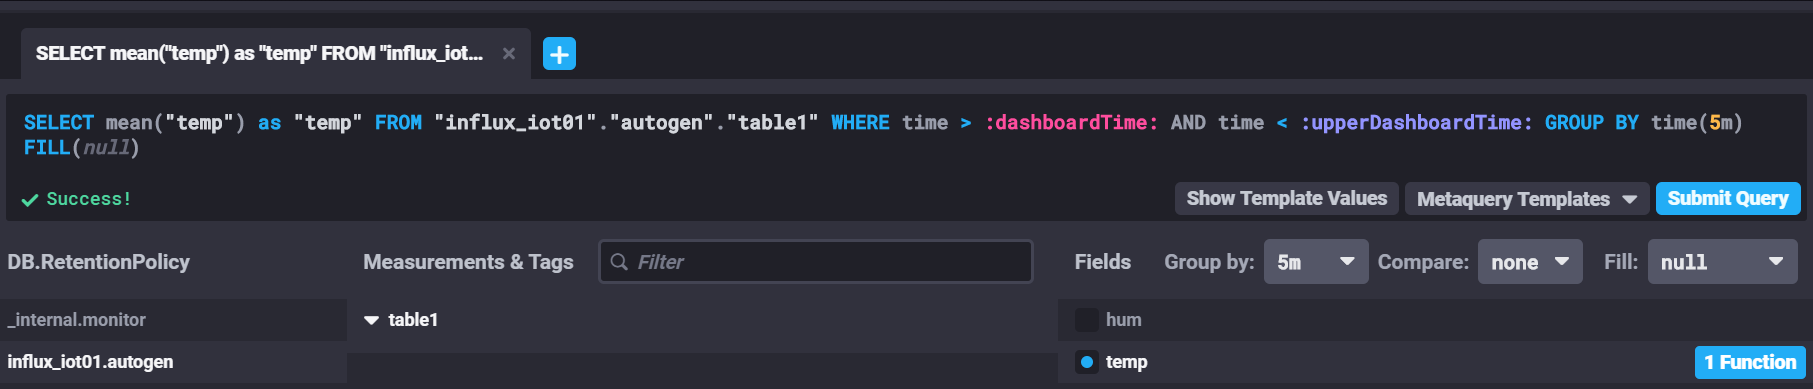
チャートのQuery設定
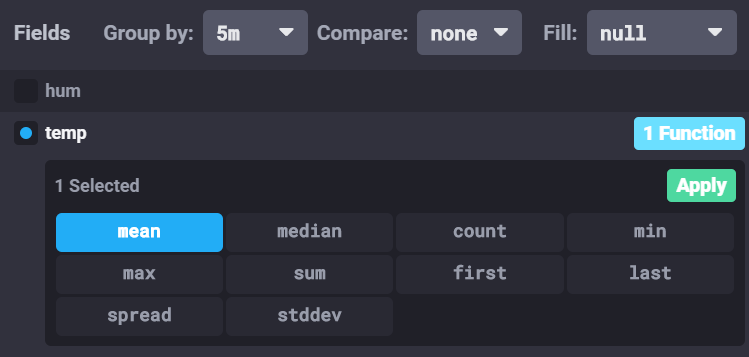
設定できるFunction一覧
ひとまずここまで
やはり、node-redで色々と時系列のグラフを苦労するよりは、圧倒的に簡単にいろいろな集計したグラフが出来ることを確認できました。ただ、グラフの種類や設定できる項目はそれほど多くなく、同じグラフに左右2軸で折れ線グラフを描くことは無理そうです。
もう少し、ちゃんとした可視化には、やはり、grafana が必要かと思われます。