回帰分析のテンプレート
- 自分用に作成している勉強用・備忘録のノートです。
- 専門的な内容は有りません。
- 間違いなどが有りましたらコメントよろしくおねがいします。
- 回帰分析と言っていますが重回帰分析のことです。特に単回帰分析と区別する必要がないと考えているので、ここでは回帰分析=重回帰分析のこととします。
- この記事での利用データセットはBoston Housing です。
目的:
- コードのテンプレート化
とりあえず実装(statsmodels)
ここでは、statsmodelsのライブラリを用いて実装。
まず必要なライブラリの読み込み
import numpy as np
import pandas as pd

import matplotlib.pyplot as plt
import seaborn as sns
%matplotlib inline

# ボストンの住宅価格予想のデータを利用
from sklearn.datasets import load_boston
import statsmodels.api as sm

# 警告メッセージを表示しない
# ボストン住宅価格のデータセットは Futrue Warning が出るので無視するため。
import warnings
warnings.filterwarnings('ignore')
データの読み込み
boston = load_boston()
df = pd.DataFrame(boston.data, columns = boston.feature_names)

# 目的変数を格納
df['PRICE'] = boston.target
# 目的変数
y = df["PRICE"]
# 説明変数
X = df[["INDUS","RM","PTRATIO","LSTAT"]]

# 説明変数に定数項(バイアス項)を追加
X = sm.add_constant(X)
モデルを作成して回帰の実行
# モデル作成
model = sm.OLS(y,X)
# fit
result = model.fit()
# 結果の出力
print(result.summary() )
結果をpandas.DataFrameで出力
#
result_coef  = result.summary().tables[0]
display(pd.read_html(result_coef.as_html(), header=0, index_col=0)[0] )
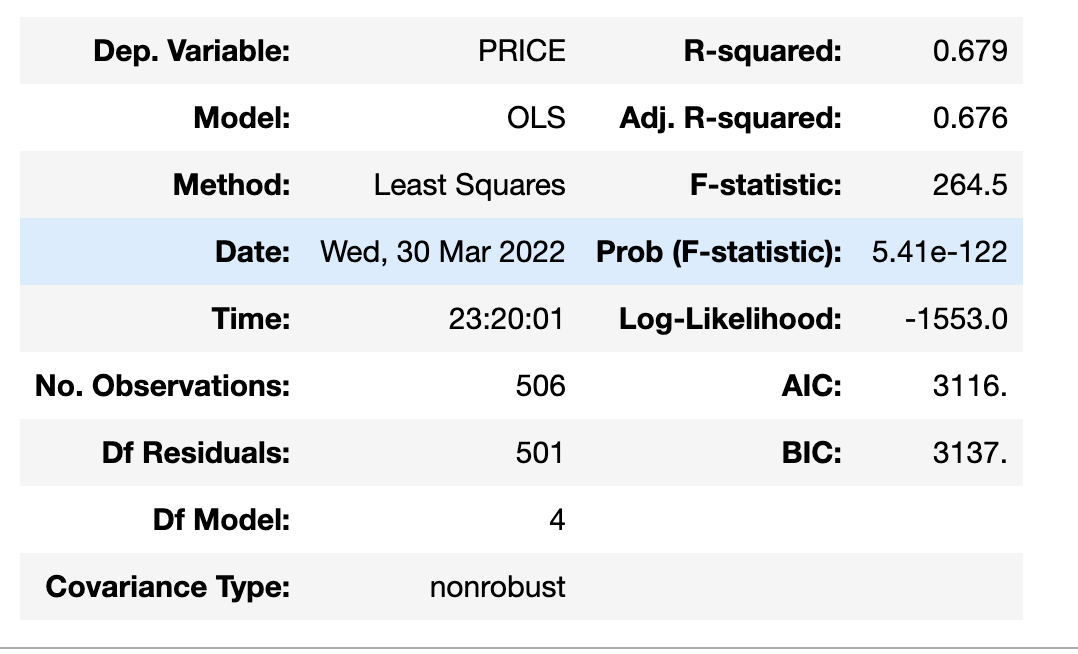
- Dep. Variable:目的変数名
- Model: モデル名。ここでは 最小二乗法(Ordinary Least Squares)
- Date, Time:作成日時
- No. Observation : サンプル数
- DF Residuals : 残差の自由度(よくわかっていない)
- R-squared :決定係数. 0~1 の間の値を取り、1に近づくほど残差平方和が小さい.
- Adj. R-squared : 自由度調整済み決定係数. 重回帰分析ではあまり重要ではない説明変数でも数を増やすほど決定係数が上がってしまうためそれを調整する必要がある。それが自由度調整済みの意味
# 回帰係数
result_coef  = result.summary().tables[1]
display(pd.read_html(result_coef.as_html(), header=0, index_col=0)[0] )
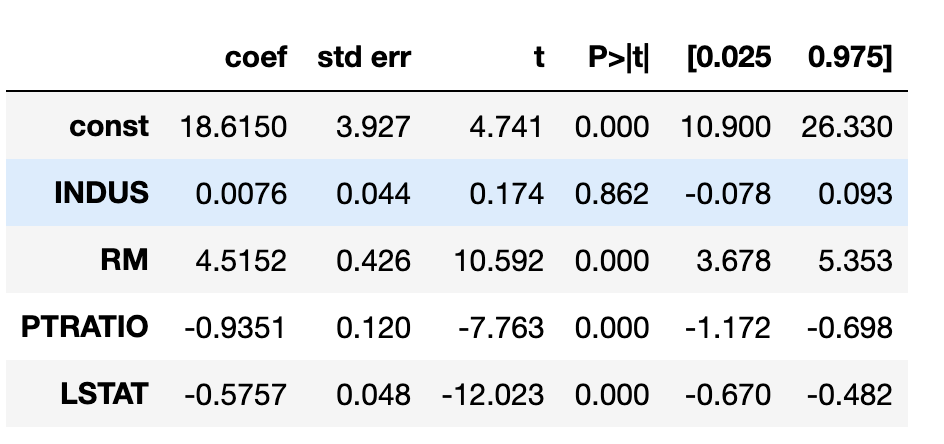
- 一番左の列は変数名. const はバイアス項
- coef は回帰係数
- std err: 決定係数の標準偏差
- t値 : 詳細は省くが回帰係数が0であるかどうかを検定するためのt値
- P値 : 詳細は省くが,回帰係数が0で有ることを帰無仮説とした検定を行った場合のP値.予め定めた有意水準(5%など)を下回れば回帰係数が0であるという帰無仮説が棄却されてしまう。
- [0.025 0.975] : 95%信頼区間
特にt値とP値については掘り下げると長くなるので、個々では省略するがいつかノートを取るかもしれない。
得られた(偏)回帰係数を利用したければ次のようにして、 result から得ることができる。
pd.read_html(result_coef.as_html(), header=0, index_col=0)[0]["coef"]
結果のプロット
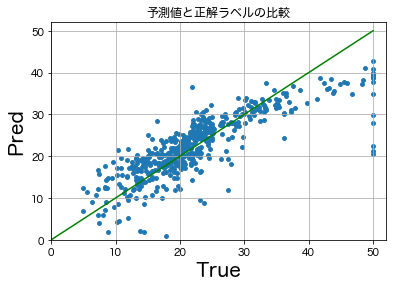
簡単に観測データと回帰による予測の比較を行う。
# matplotlib で日本語を出力できるようにする。
from matplotlib import rcParams
rcParams['font.family'] = 'sans-serif'
rcParams['font.sans-serif'] = ['Hiragino Maru Gothic Pro', 'Yu Gothic', 'Meirio', 'Takao', 'IPAexGothic', 'IPAPGothic', 'VL PGothic', 'Noto Sans CJK JP']
実際にmatplotlib で図を出力してみる。
fig = plt.figure()
ax = fig.add_subplot(1,1,1)
ax.scatter(y, y_pred, s=15)
plt.xlabel('True', fontsize=20)
plt.ylabel('Pred', fontsize=20)
# plt.plot([0, 50], [0, 50], c="g")
plt.title("予測値と正解ラベルの比較",)
plt.xlim(0,52)
plt.ylim(0,52)
plt.grid()
plt.show()
おそらく次のようなプロットが出力される。
標準化
通常回帰分析を行う場合は標準化(正規化)をおこなう。 先程の例で標準化を行わなかったのは説明変数,例えば平均の部屋数が1増えると実際にどれくらいの価格上昇が起きるのか?を見たかったから。


