JupyterでこねたグラフをWebサイト上に表示させたいというケースは案外多いのではないでしょうか。Bokehを使えばインタラクティブで見栄えの良いグラフを簡単にHTMLに埋め込む事が可能です。
データ
Bokeh公式のcategorical scatterプロットの例を使用していきます。
from bokeh.io import output_notebook, show
from bokeh.models import ColumnDataSource
from bokeh.plotting import figure
from bokeh.sampledata.commits import data
from bokeh.transform import jitter

# output_file("bars.html")
output_notebook() # Jupyter notebook上で動かす場合

DAYS = ['Sun', 'Sat', 'Fri', 'Thu', 'Wed', 'Tue', 'Mon']

source = ColumnDataSource(data)

p = figure(plot_width=700, plot_height=400, y_range=DAYS, x_axis_type='datetime', title="Commits by Time of Day (US/Central) 2012—2016")
p.circle(x='time', y=jitter('day', width=0.45, range=p.y_range),  source=source, alpha=0.3)
p.xaxis[0].formatter.days = ['%Hh']
p.x_range.range_padding = 0
p.ygrid.grid_line_color = None

show(p)
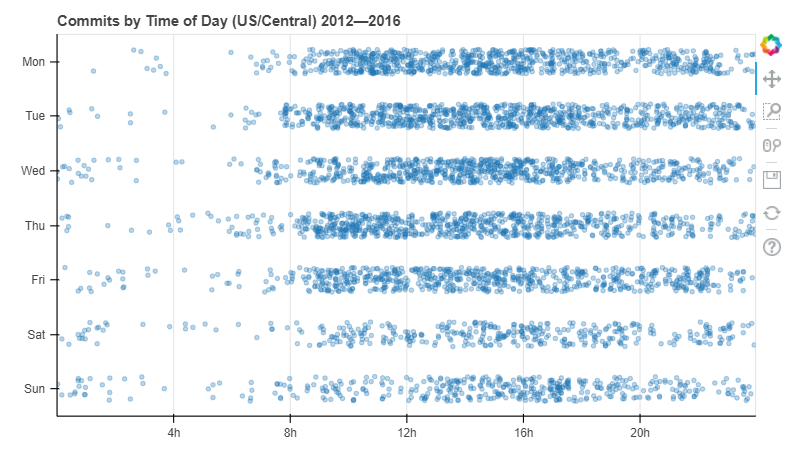
このグラフは2012-2016年におけるGitHub上のBokehリポジトリのコミット時刻(曜日毎)
を表しているそうです。ジッター散布図になっていてとても見易いですね。
埋め込み
プロットしたfigureオブジェクトをbokeh.embed.componentsに渡すと、埋め込み用のHTMLタグが取得できます。
from bokeh.embed import components
script, div = components(p)
<!-- script -->
<script type="text/javascript">
  (function() {
    // 略
  })();
</script>

<!-- div -->
<div class="bk-root">
    <div class="bk-plotdiv" id="a13d4bde-f3a8-4777-ab92-44973aaea397"></div>
</div>
また、↑のタグは単体では動作しません。Bokehを動作させるためのランタイムが必要となります。適当なところでロードしておきましょう。
<!-- Bokeh 0.12.13を使用する場合。他バージョンの場合は要バージョン番号書き換え -->
<link href="https://cdn.pydata.org/bokeh/release/bokeh-0.12.13.min.css" rel="stylesheet" type="text/css">
<link href="https://cdn.pydata.org/bokeh/release/bokeh-widgets-0.12.13.min.css" rel="stylesheet" type="text/css">
<link href="https://cdn.pydata.org/bokeh/release/bokeh-tables-0.12.13.min.css" rel="stylesheet" type="text/css">
<script src="https://cdn.pydata.org/bokeh/release/bokeh-0.12.13.min.js"></script>
<script src="https://cdn.pydata.org/bokeh/release/bokeh-widgets-0.12.13.min.js"></script>
<script src="https://cdn.pydata.org/bokeh/release/bokeh-tables-0.12.13.min.js"></script>
実際にこれらのタグをHTMLに埋め込んでみたサンプルです。CodePen便利...
See the Pen bokeh-embed by yoku (@yoku001) on CodePen.
** Codepen**
Jupyter上と変わらず操作できる事が分かるかと思います。
参考
Embedding Plots and Apps - Bokeh
https://bokeh.pydata.org/en/latest/docs/user_guide/embed.html
Qiitaで記事にCodePenが埋め込めるようになりました - Qiita
https://qiita.com/Qiita/items/edae7417214c8e957f54
