最近、Airbnb 社のオープンソース BI ツール Superset 1 を試しています。
Superset が UI で指標をピボットしてグラフを描画できる点は re:dash と比べて圧倒的に便利そうで... おっと、re:dash の Advent Calendar でした。
この記事は re:dash Advent Calendar 2016 12/24の記事です.
re:dash でちょっとクセのあるコホートグラフの作成方法を簡単にまとめます。
Cohort(コホートグラフ)
ユーザーのサービス継続利用率の可視化に、コホートグラフが有用です。
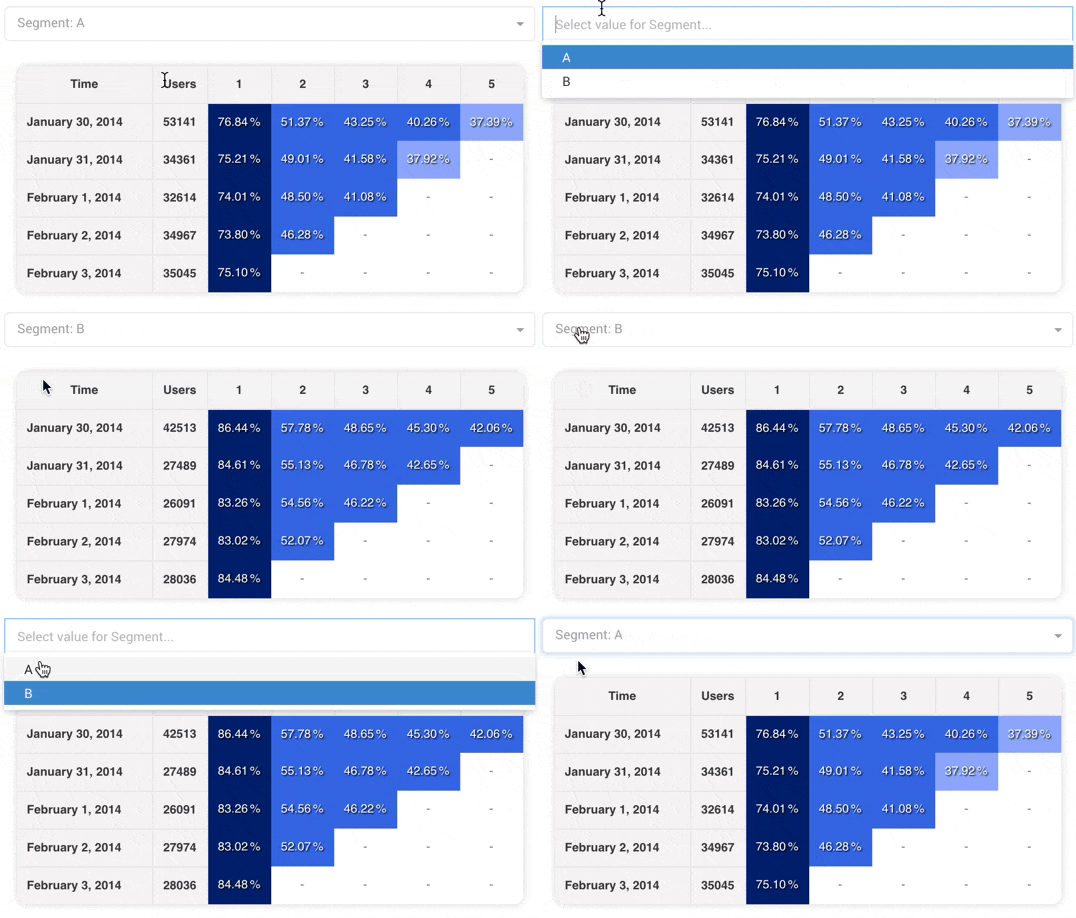
サンプルを以下に載せます。セグメントによって継続利用率を比較すことがコホート分析では重要になるため、自社では filter を利用してこのように 〇〇をした人/していない人の継続利用率を比較しています。
描画のポイント
-
コホートグラフ描画に必要なカラム
- date(獲得日)
- day_number(獲得日から x 日/週/月経過)
- 昇順ソートされていればカラムが無くても描画できるようだが、入れた方が無難
- value(獲得日から x 日/週/月目の訪問人数)
- total(獲得日の人数(母数))
-
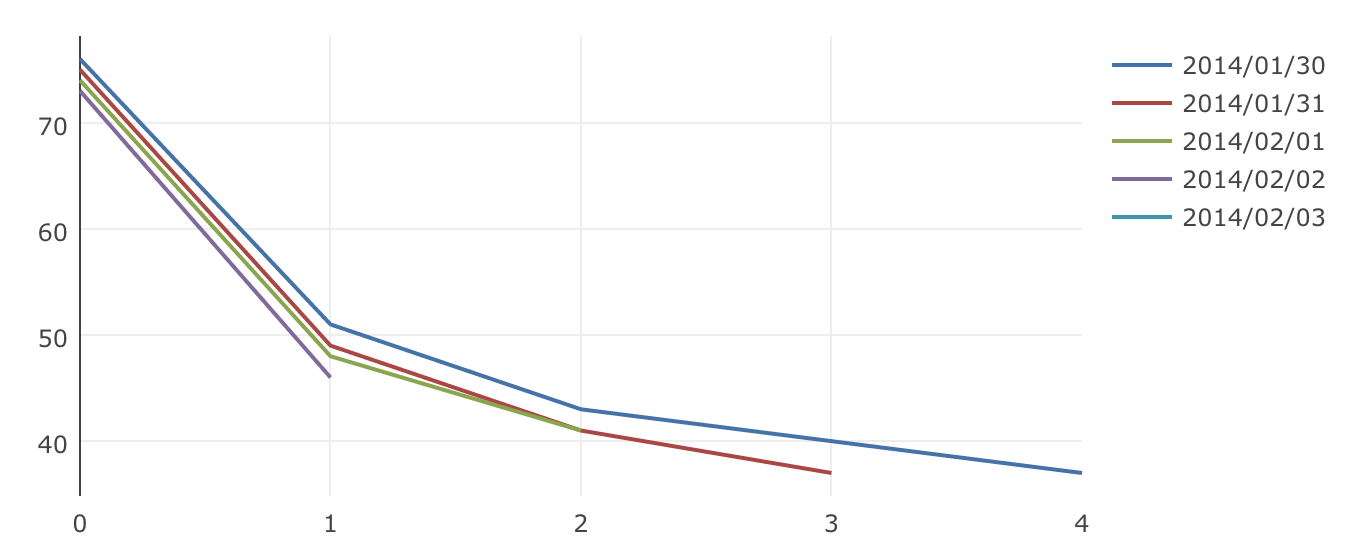
リテンションカーブを描くには
- 訪問率(value/total) を計算したカラムを用意し、y 軸の指標にするだけです
- Date カラムを Group By の指標に選択すると凡例に TimeZone など含まれて長くなるので、サンプルグラフでは日付を文字列型に cast したカラムも用意しています
※ 文字に起こすと分かりにくいと思いますので、詳しくはこちらのサンプルのソースを Folk 等して試してもらえればと思います。
ログのローデータから SQL を書くポイント
サンプルのデータソースでは、コホートグラフ描画用に整形済みのデータですが、アクセスログからコホートグラフを作るのはちょっと大変になります。
id, log_date, user_id のみの access テーブルから日次のコホートグラフの描画を行うための SQL(PostgreSQLで)は、こんなかんじでしょうか。
with first_access as (
    select user_id, min(log_date) as first_access_date
    from access
    group by 1
    having min(log_date) >= current_date - cast('1 month' as interval) -- 直近1ヶ月の新規獲得ユーザーのみ
)

select total.first_access_date as date
    , datediff(day, fa.first_access_date, a.log_date) as day_number
    , count(a.user_id) as value
    , total.cnt as total
from access a
    inner join first_access fa on fa.user_id = a.user_id
, ( select first_access_date
        , count(user_id) as cnt
    from first_access
    group by 1
  ) as total
where fa.first_access_date = total.first_access_date
group by 1, 2, 4
order by 1, 2, 4
・・・書くのも大変ですし、データ量によってはかなり重いクエリになります。
そのため、自社ではユーザーごとの1日のアクセスを日次集計して参照するようにしています。
以上、参考にしてコホートグラフを re:dash でバンバン活用していただけると幸いです。
※ 日付が過ぎてしまって申し訳ありません、メリークリスマス!

