はじめに
統計学を専攻していた時、階層線形モデル(Hierarchical Linear Model)の授業を受講したのですが、当時の自分には(今でも少し)理解がむつかしかったので、リベンジするためにブログにまとめようと思いました。
前回の【階層線形モデル(HLM)】学生時代挫折した階層線形モデル(HLM)についてまとめてみる -解説編ではHLMについて解説したので、今回はRで実装してみます。
使用するデータはShigeto Kawaharaさんからインスピレーションを受け、ポケモンの攻撃力(Attack)と防御力(Defense)の関係に、タイプという階層を挿入してみたいと思います。データセットはこちら。
Setup
library(dplyr)
library(tidyverse)
library(ggplot2)
library(lme4) # HLM実装用
library(merTools) # ICC算出用
df = read.csv("pokemon.csv") # データ読み込み
今回はCRANのlme4というライブラリを使ってHLMを走らせようと思います。
可視化
まず、データセットにHLMを使うべきか検討します。
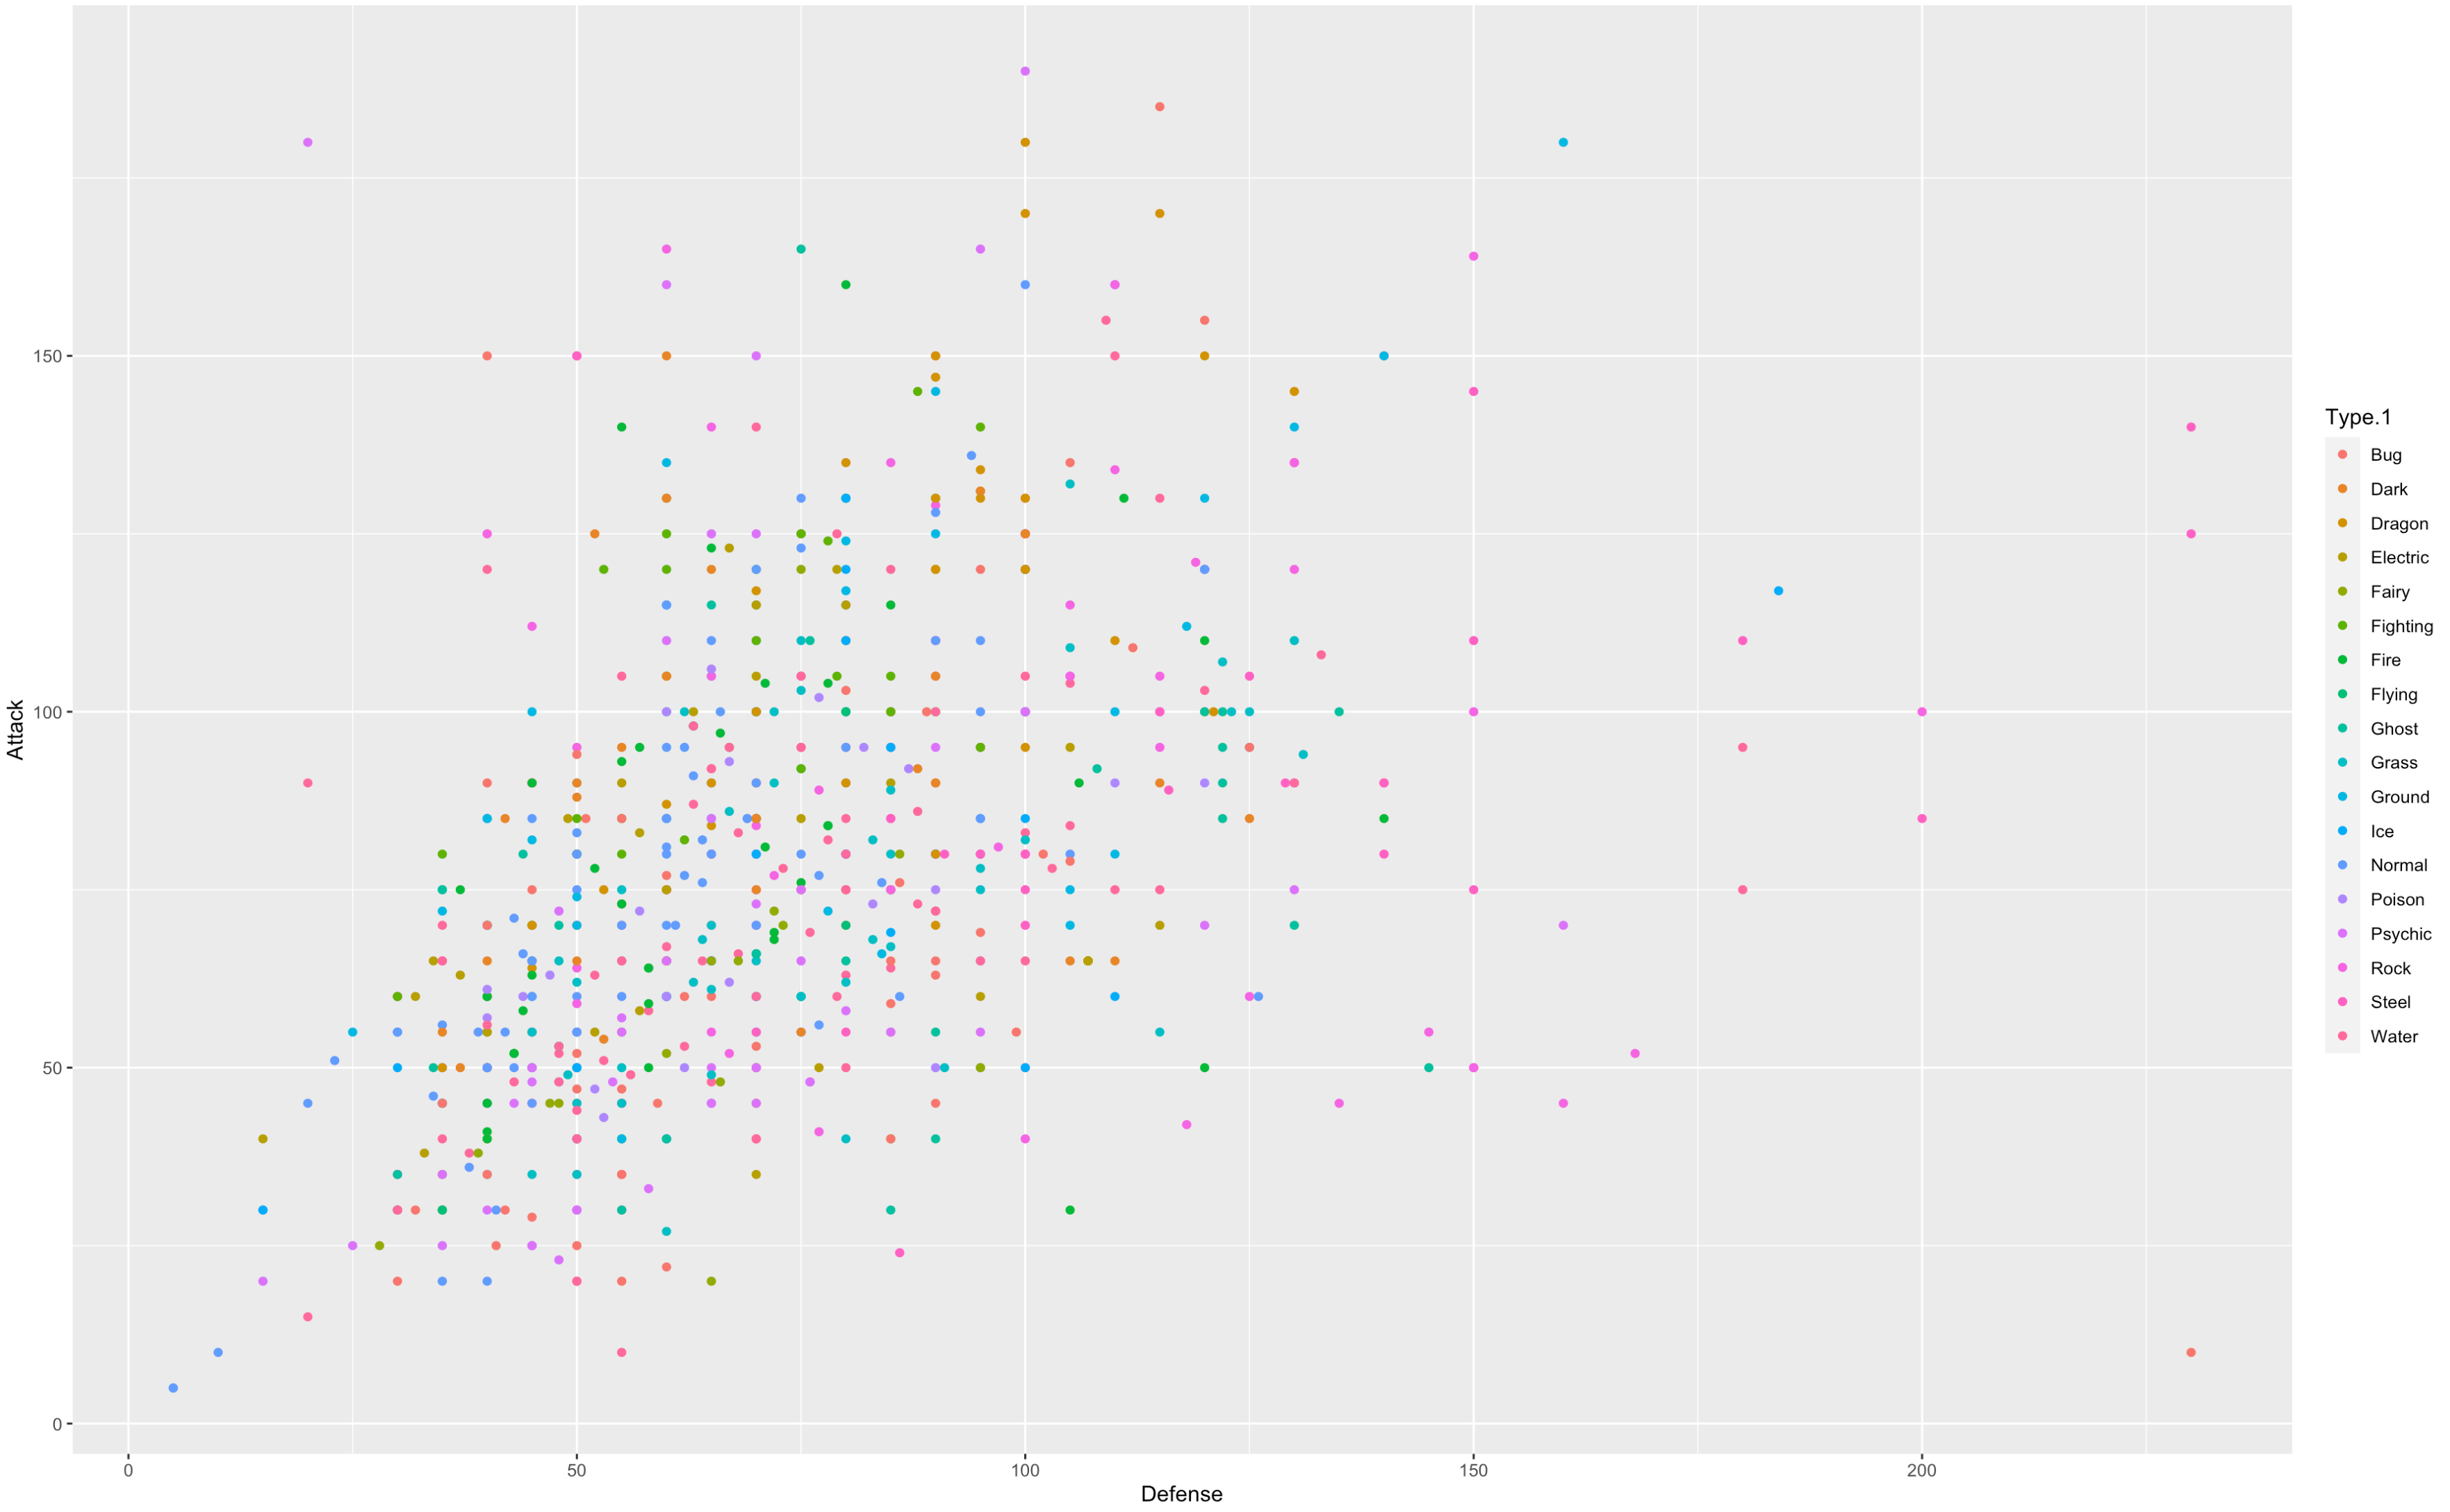
ggplot(data = df, aes(y= Attack , x = Defense, color =Type.1) ) +
  geom_point()
、、これだけでは何とも、、線を入れてみます。
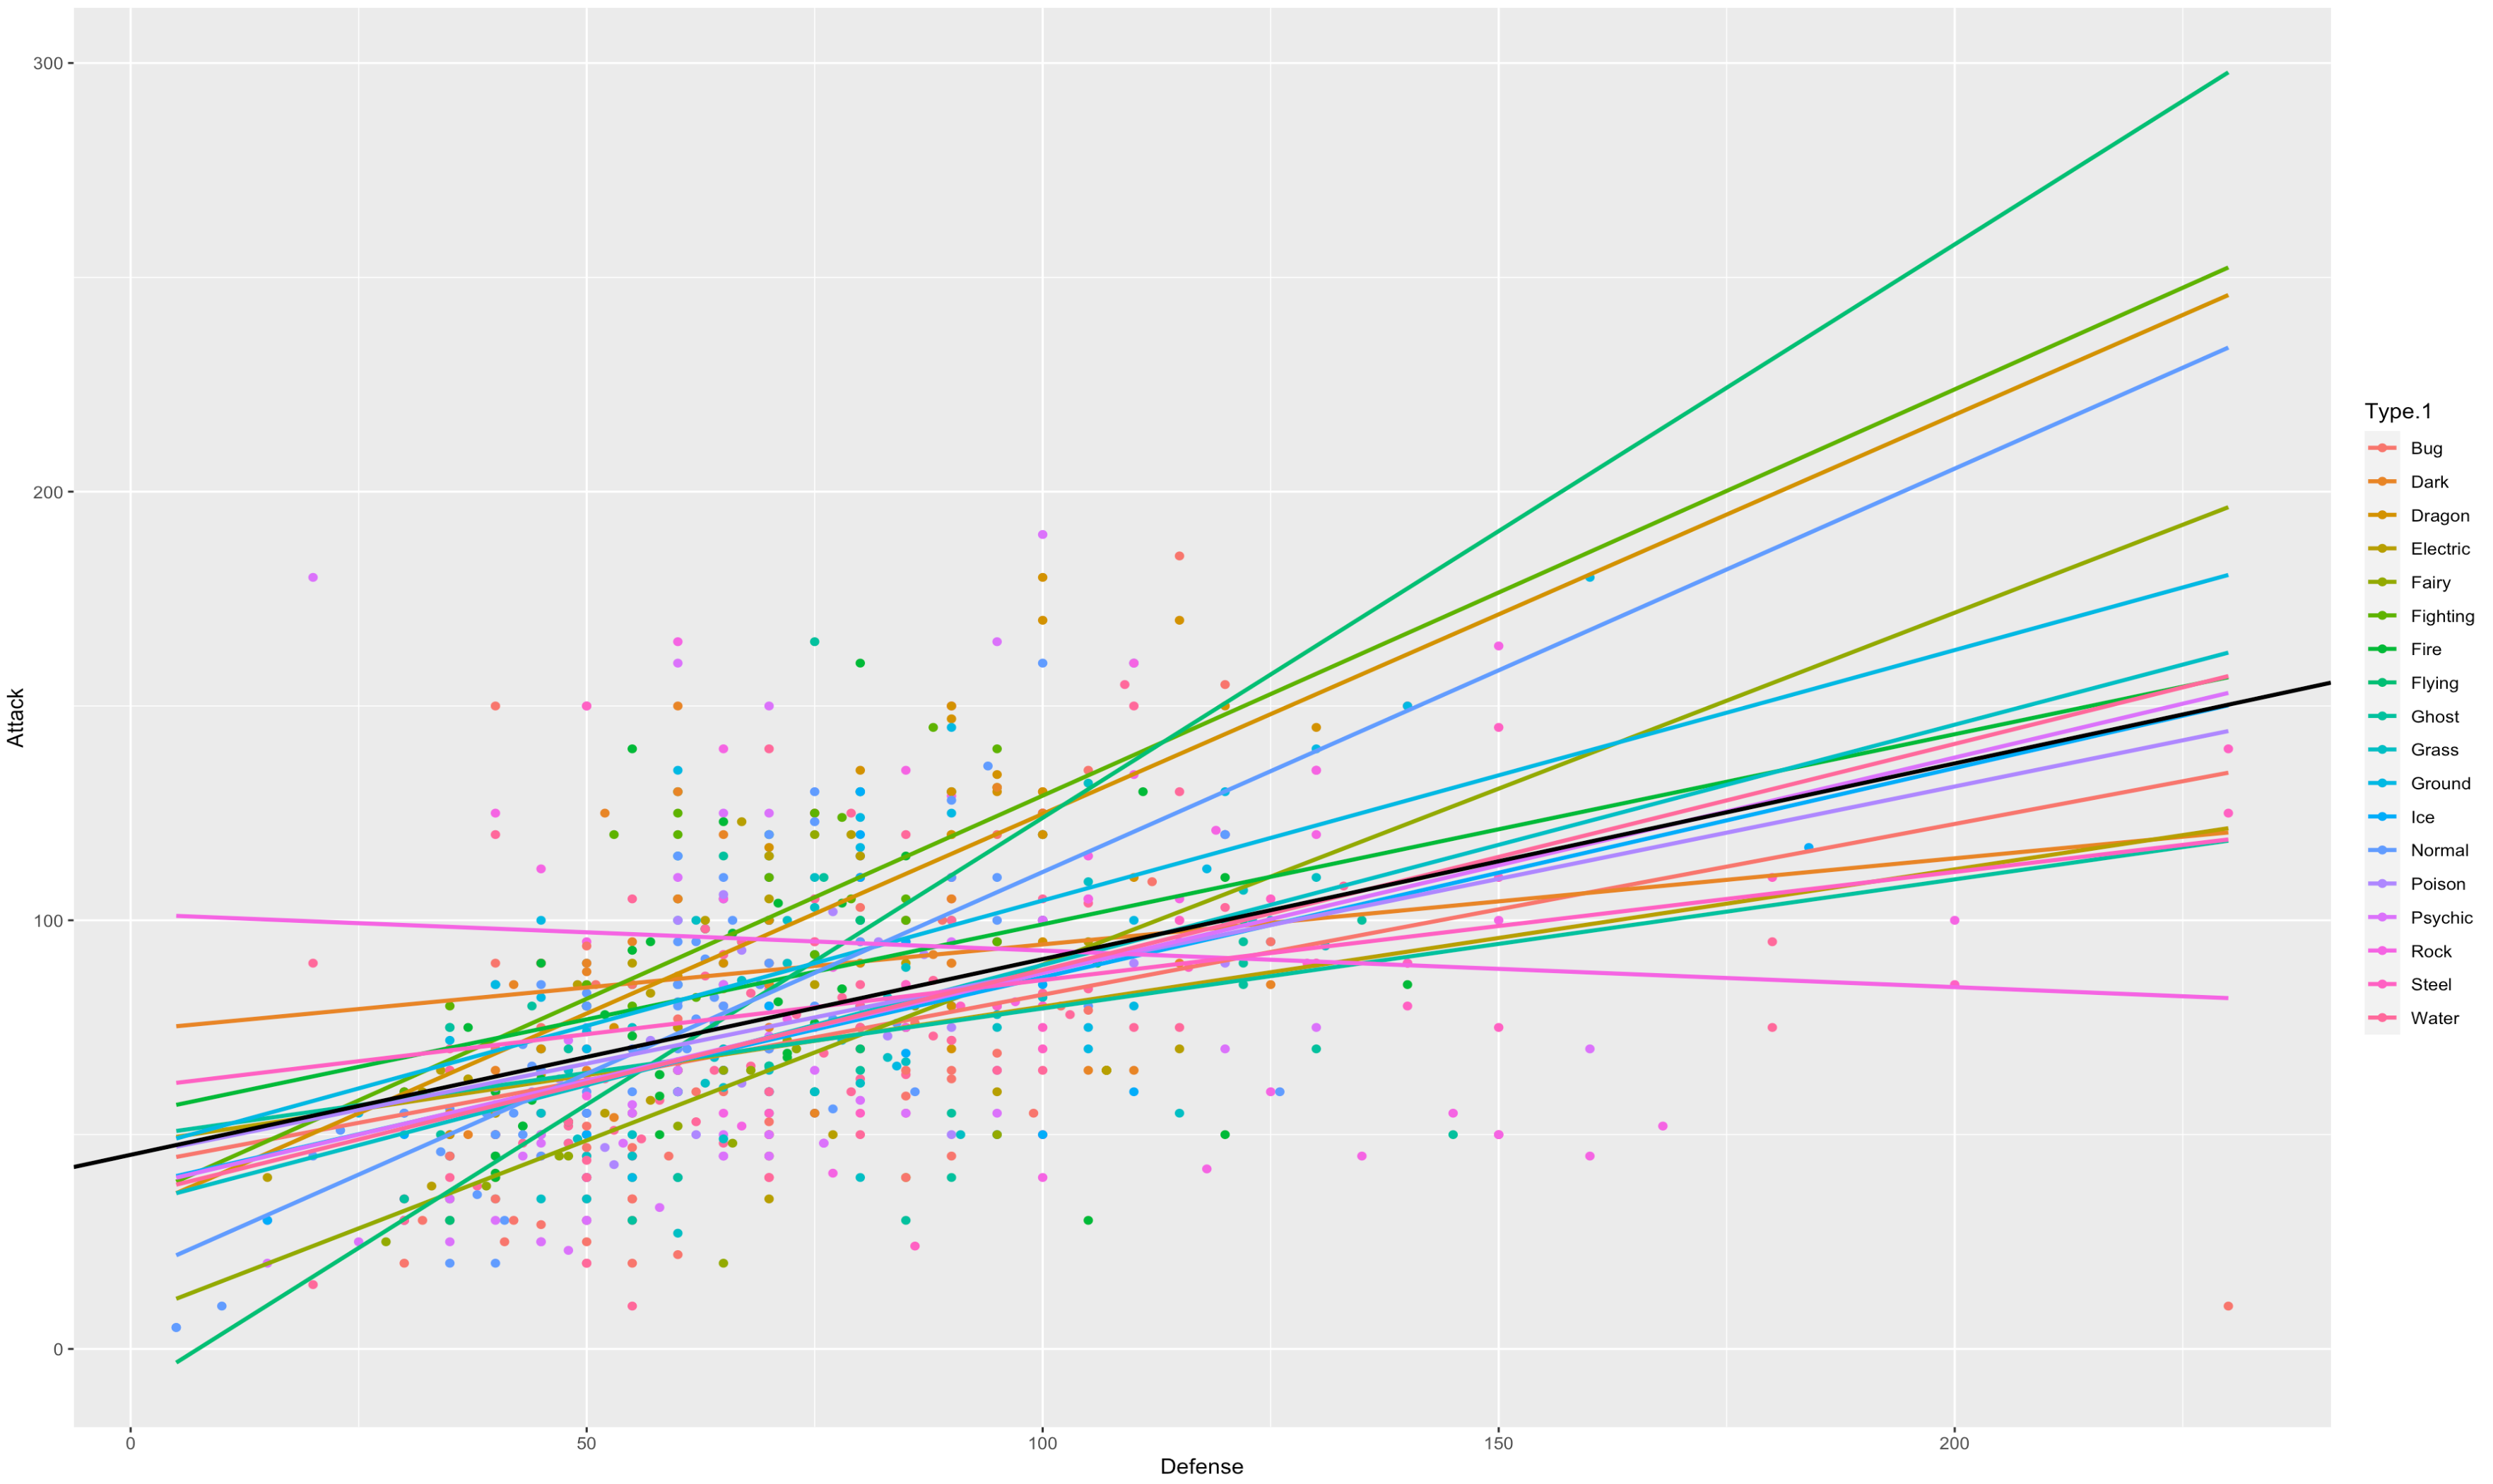
ggplot(data = df, aes(y= Attack , x = Defense,color =Type.1,alpha = 0.1)  ) +
  geom_point(aes(color =Type.1))+
  geom_smooth(method=lm, se=FALSE, fullrange=T)+
  geom_abline(intercept = 45.28420, slope = 0.45661, size = 1)

タイプごとの回帰線を引きました。黒い線はタイプを考慮しない、AttackとDefenseだけの場合で回帰線を引いた場合の回帰線になります。
geom_smoothのメソッドでlmを指定することでタイプごとの直線を引きます。
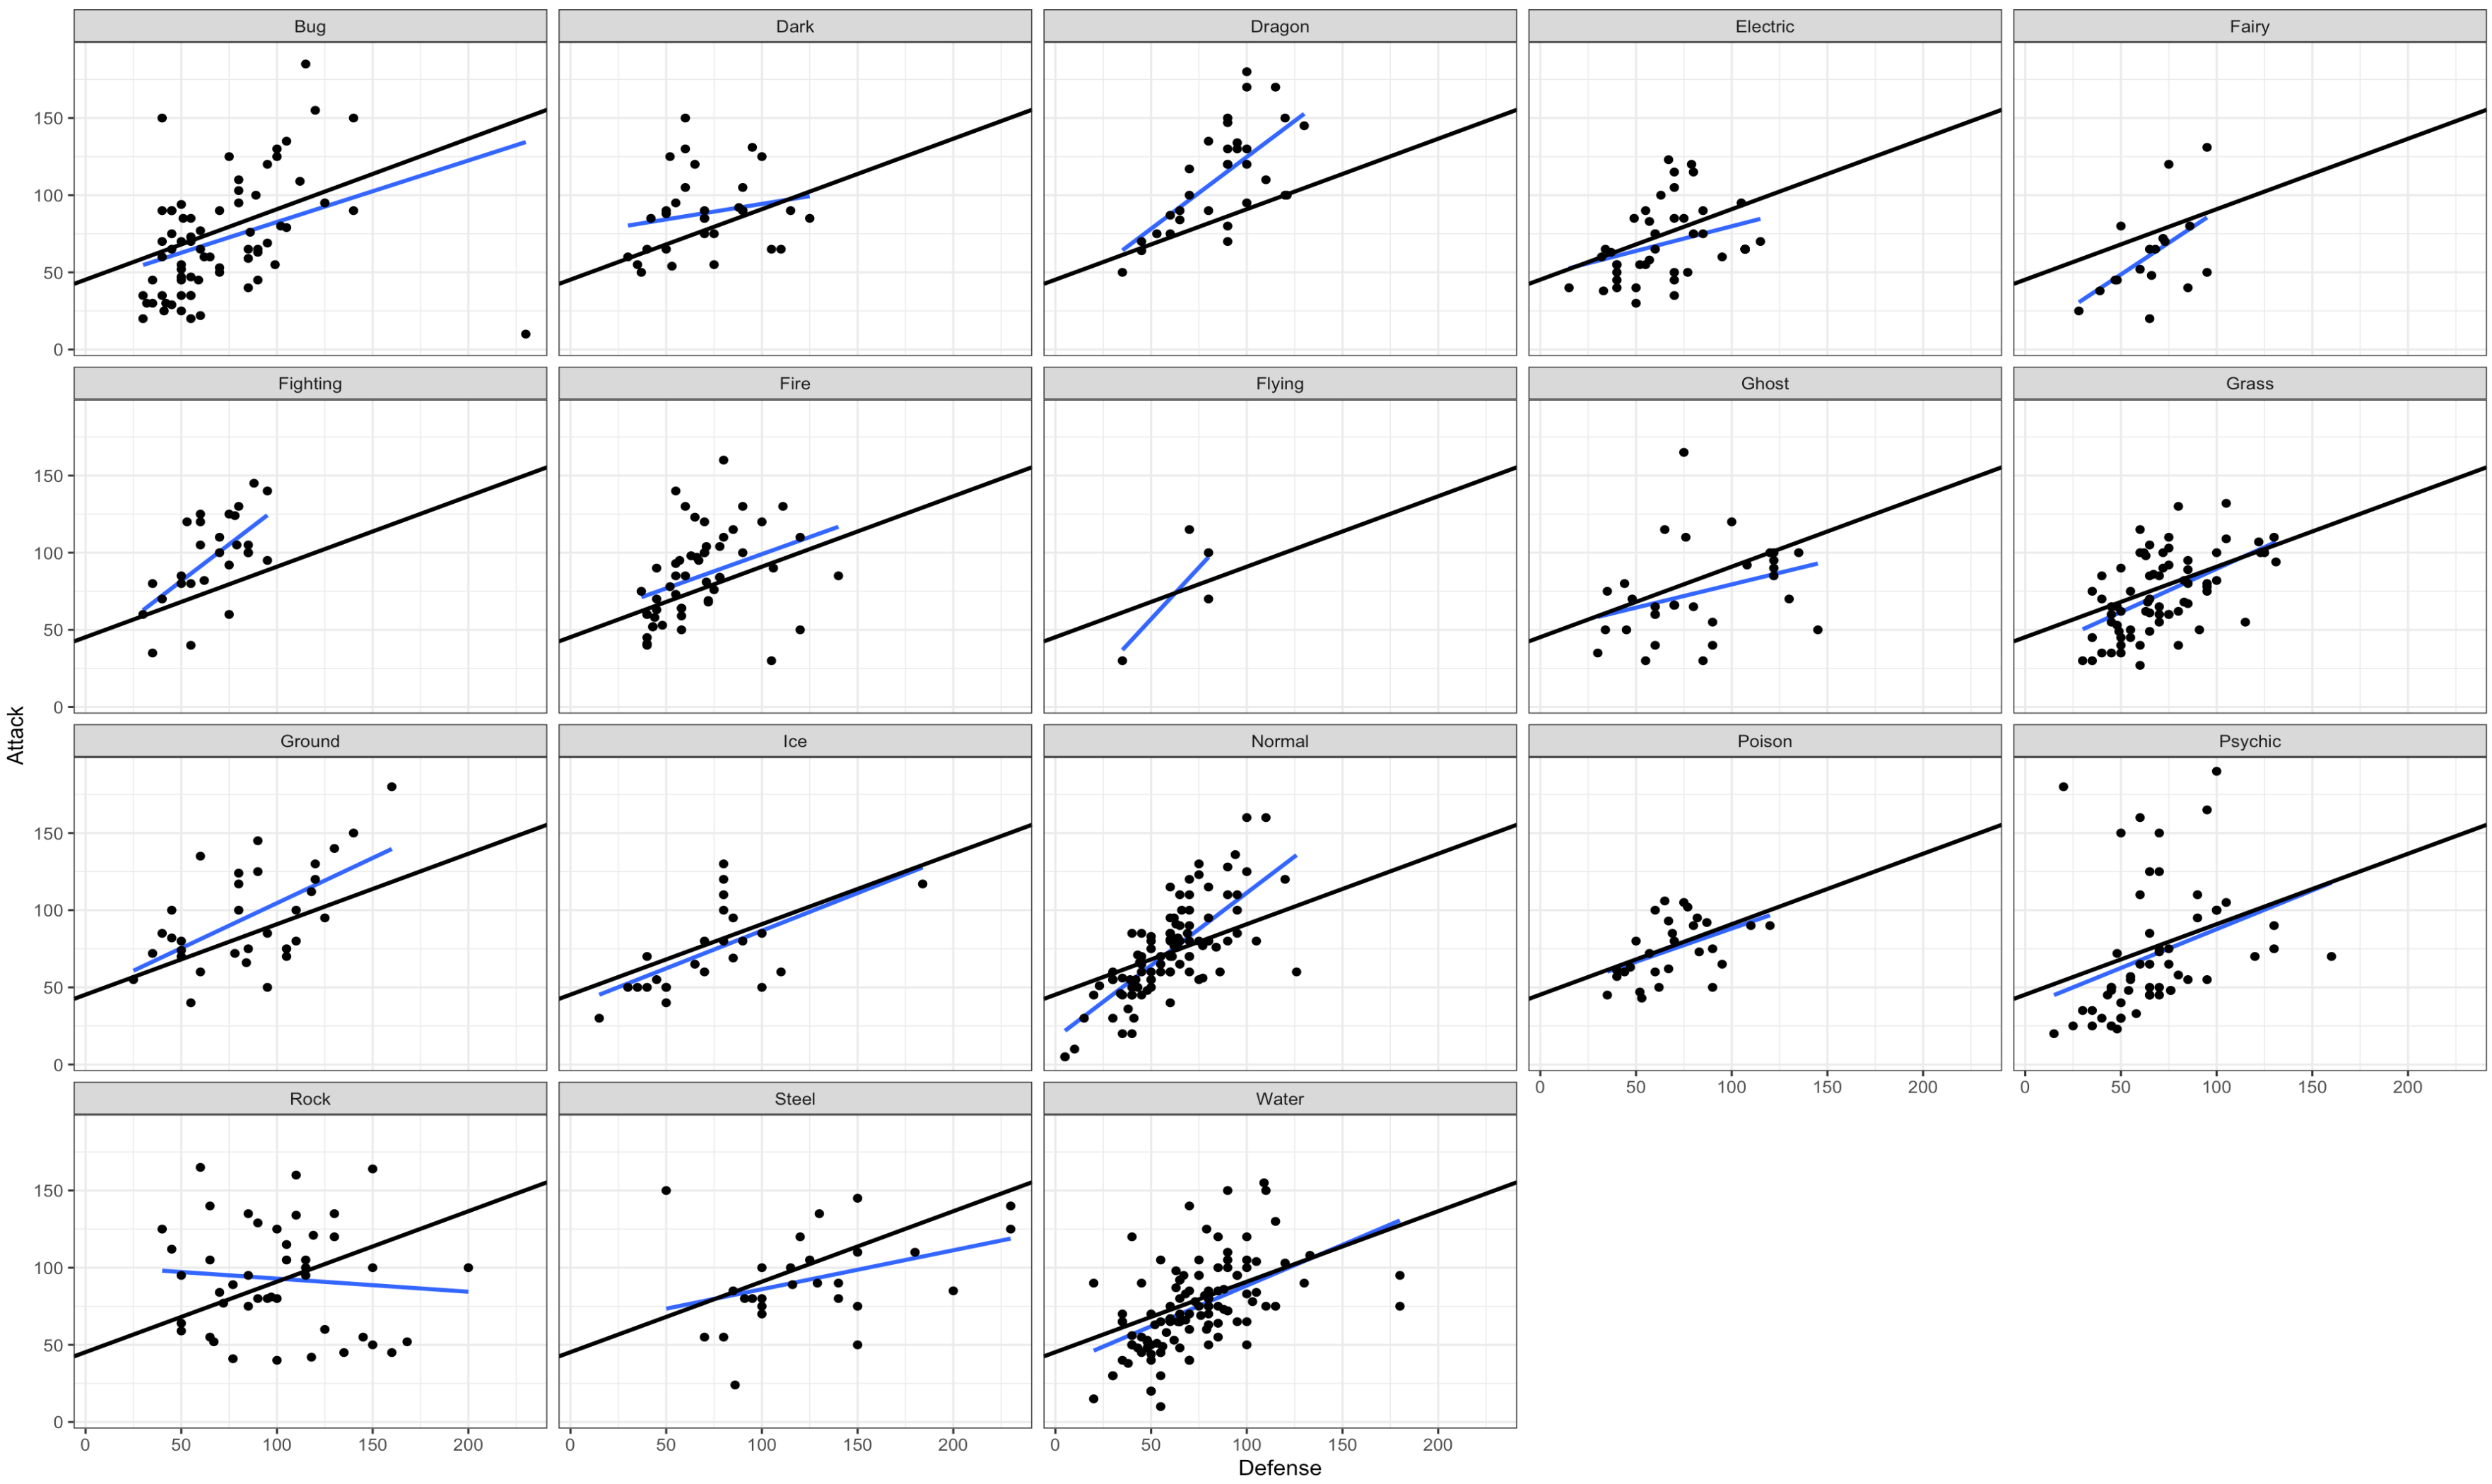
ggplot(df) +
  aes(x = Defense, y = Attack) +
  stat_smooth(method = "lm", se = FALSE) +
  geom_point() +
  geom_abline(intercept = 45.28420, slope = 0.45661, size = 1)  +  #fixed part of model1
  facet_wrap(~Type.1) +
  theme_bw()

タイプごとの線の角度が、全体の回帰線の傾きより乖離していればしているほどHLMを導入する価値があるという事です。タイプごとにかなり傾きに偏りがありそうです。
Intra-class Correlation Coefficient (ICC)
HLMを導入する際の重要な指標としてICCというものがある事を説明しました。merToolsライブラリを使用し、ICCの値を見てみましょう。0.1以上ある場合はHLMを導入する価値があります。
merTools::ICC(outcome = 'Attack', group = 'Type.1', data = df)
[1] 0.2788982
ICCが0.3近くありました。HLMを導入する価値があると言えるでしょう。
モデル形成
lmerファンクションを使ってモデルを作ってみましょう。シンタックスは以下の様になります。
model1 = lmer(Attack ~ Defense + (1 + Defense | Type.1), data  = df)
summary(model1, corr=F)
Linear mixed model fit by REML ['lmerMod']
Formula: Attack ~ Defense + (1 + Defense | Type.1)
   Data: df

REML criterion at convergence: 7608.3

Scaled residuals:
    Min      1Q  Median      3Q     Max
-4.6706 -0.6425 -0.1311  0.5187  4.8451

Random effects:
 Groups   Name        Variance  Std.Dev. Corr
 Type.1   (Intercept) 463.23365 21.5229
          Defense       0.07763  0.2786  -0.90
 Residual             738.57885 27.1768
Number of obs: 800, groups:  Type.1, 18

Fixed effects:
            Estimate Std. Error t value
(Intercept) 44.68062    6.04617   7.390
Defense      0.49710    0.07811   6.364
convergence code: 0
Model failed to converge with max|grad| = 1.42345 (tol = 0.002, component 1)
Model is nearly unidentifiable: very large eigenvalue
 - Rescale variables?
Review
前回、HLMの方程式を解説しました。
Y_{ij} = \alpha_{0j} + \beta_{1j}X + e_{ij} \\
\alpha_{0j} = \gamma_{00} + r_{1j}\\
\beta_{1j} = \gamma_{10} + r_{2j}\\
j:階層内のグループ(クラスA,B,C)
$\gamma_{00}$:全ての値の平均の切片
$r_{1j}$:グループ毎の切片
$\gamma_{10}$:全ての値の平均の傾き
$r_{2j}$:グループ毎の傾き
Y_{ij} = \gamma_{00} + \gamma_{10}X + r_{1j} + r_{2j}X +e_{ij} \\
ここでいう
$\gamma_{00}$と$\gamma_{10}$がFixed Effects、
$r_{1j}$と$r_{2j}$がRandom Effectsにあたります。
fixef(model1) # Fixed Effects のみを抽出
(Intercept)     Defense
 44.6806214   0.4970961
Random Effectは、全ての値の切片と傾きを表すので、クラスの数分あります。
ranef(model1) # Random Effects のみを抽出
$Type.1
          (Intercept)      Defense
Bug       -1.65489024 -0.088804864
Dark      20.63474624 -0.195328122
Dragon   -10.22342946  0.358546055
Electric   1.13561226 -0.124824074
Fairy    -20.18076262  0.142343389
Fighting   1.77083104  0.195486653
Fire       8.38802594 -0.042083231
Flying    -6.77824607  0.104634161
Ghost      4.35268887 -0.168964980
Grass     -9.50381544  0.050151994
Ground     0.06393304  0.085851005
Ice       -4.88047726 -0.009239055
Normal   -23.63492890  0.375494092
Poison    -0.76271843 -0.036175345
Psychic   -6.41853421  0.006104521
Rock      42.31312077 -0.458369507
Steel     13.54121387 -0.220083655
Water     -8.16236939  0.025260963

with conditional variances for “Type.1”
解釈の仕方は一般的な回帰と同じなので、
例えば、
「平均的なDarkタイプのポケモンは他のタイプの平均より、20.635ポイント攻撃力が高いが、防御力上昇による攻撃力の増え幅は1ポイント増える毎に他のタイプの平均より0.195ポイント低い。」
という様に解釈できます。
補足
model1を作成するとき以下の様なエラーが出てしまいます。これはクラスごとの分散の差が極端に大きい際に出現するものです。model2のチャンクの様に分散をリスケールしてあげると解消されます。(今回は説明のため触れていませんが、本来はりスケールする事をお勧めします)。
Model failed to converge with max|grad| = 1.42345 (tol = 0.002, component 1)Model is nearly unidentifiable: very large eigenvalue - Rescale variables?
model2 =  lmer(log(Attack) ~ log(Defense) + (1 + log(Defense) | Type.1), data  = df)
summary(model2, corr=F)
終わりに
自分が学生時代に挫折した階層線形モデル(Hierarchical Linear Model)をざっくりまとめてみました!ありがとうございました!
参考文献
- https://www.youtube.com/watch?v=lY_dzLMF4Jo Kawahara (2020)
- https://www.medi-08-data-06.work/entry/stratified_model Koo (2019)
- http://user.keio.ac.jp/~nagakura/R/R_ordered_logit.pdf Nagakura
- https://towardsdatascience.com/hierarchical-linear-modeling-a-step-by-step-guide-424b486ac6a3 Chansiri (2021)
- http://cogpsy.educ.kyoto-u.ac.jp/personal/Kusumi/datasem17/nishiguchi1.pdf 西口 (2016)
