Introduction
This article aims to provide an in-depth understanding of financial analysis using the quantmod package. Quantmod integrates various financial data platforms, offering a comprehensive framework for quantitative financial modeling and trading in R. This guide will also delve into the specifics of the APIs provided by these platforms, shedding light on the parameters required for effective data retrieval and analysis.
Overview
quantmod is an R package that provides a framework for quantitative financial modeling and trading. It provides a rapid prototyping environment that makes modeling easier by removing the repetitive workflow issues surrounding data management and visualization. - Github
Sample Code
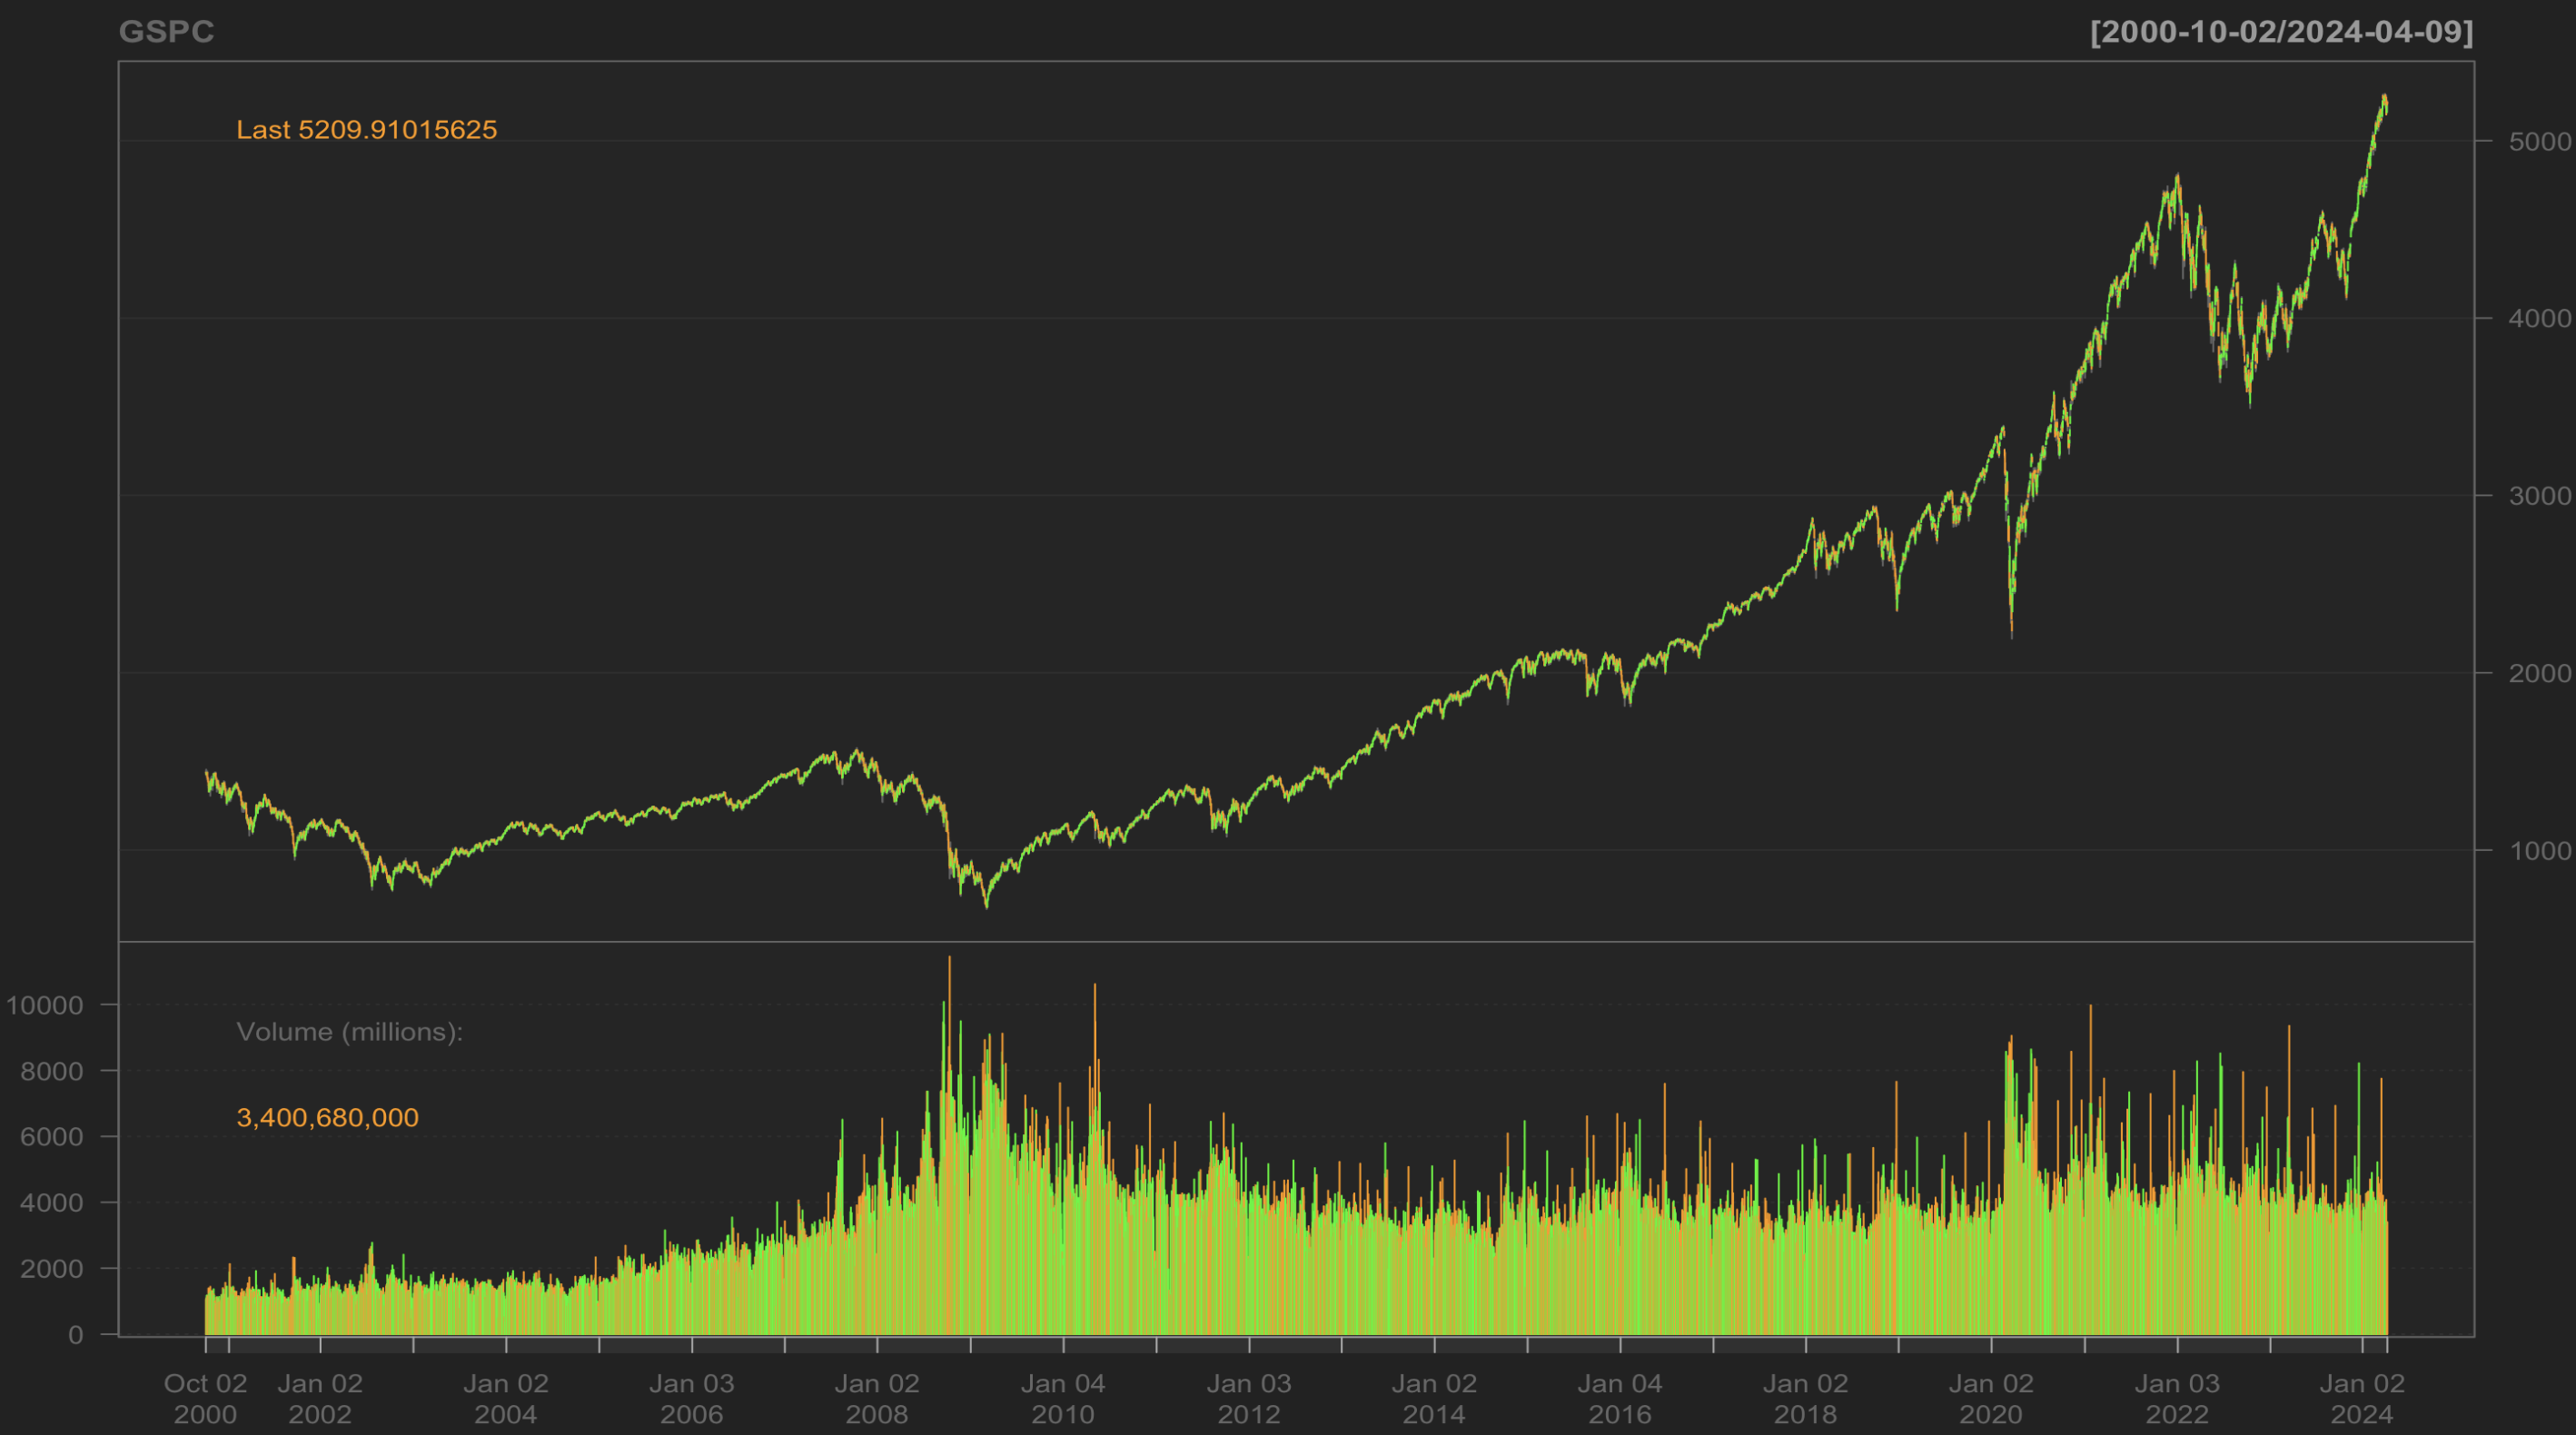
# install.packages("quantmod")
library(quantmod)

# Dates
start <- "2000-10-01"
end <- "2024-04-10"

# Get the data
getSymbols("^GSPC",
            from = start, to = end,
            src = "yahoo")

 # Plot the data

 chartSeries(GSPC)
APIs
My main concern is that how this package gets it’s financial data and where does it get them from. The user can choose types of API by changing parameter src in getSymbols function. There are several APIs that quantmod covers, this section uncovers all related APIs.
Yahoo Finance
The user can use API from Yahoo Finance (I could not find official document) by setting src="yahoo".
From GitHub, getSymbols.yahoo function calls API below.
.yahooJsonURL <-
function(symbol, from, to, interval)
{
  u <- paste0("https://query2.finance.yahoo.com/v8/finance/chart/",
              symbol,
              sprintf("?period1=%.0f&period2=%.0f&interval=%s", from, to, interval))
  return(u)
}

#====================================================================================#

yahoo.URL <- .yahooJsonURL(Symbols.name, from.posix, to.posix, interval)

conn <- curl::curl(yahoo.URL, handle = handle)

y <- jsonlite::fromJSON(conn)
https://query2.finance.yahoo.com/v8/finance/chart/ is the base URL, the function requires symbol, date , and interval for the attributes. And it does not seems require any keys. Let’s try calling the API.
Params
| Params | Description |
|---|---|
| symbol | ticker symbol. CHAR |
| range | Range of the data. [1m, 2m, 5m, 15m, 30m, 60m, 90m, 1h, 1d, 5d, 1wk, 1mo, 3mo] |
| period1 | Start time UNIX timestamp |
| period2 | End time UNIX timestamp |
| interval | Length of the candle plot. |
| events | Dividend(div)、Stock Split(split) |
Responce
{
    "chart": {
        "result": [
            {
                "meta": {
                    "currency": "USD",
                    "symbol": "AAPL",
                    "exchangeName": "NMS",
                    "fullExchangeName": "NasdaqGS",
                    "instrumentType": "EQUITY",
                    "firstTradeDate": 345479400,
                    "regularMarketTime": 1712779201,
                    "hasPrePostMarketData": true,
                    "gmtoffset": -14400,
                    "timezone": "EDT",
                    "exchangeTimezoneName": "America/New_York",
                    "regularMarketPrice": 167.78,
                    "fiftyTwoWeekHigh": 169.09,
                    "fiftyTwoWeekLow": 167.11,
                    "regularMarketDayHigh": 169.09,
                    "regularMarketDayLow": 167.11,
                    "regularMarketVolume": 49403371,
                    "chartPreviousClose": 192.53,
                    "priceHint": 2,
                    "currentTradingPeriod": {
                        "pre": {
                            "timezone": "EDT",
                            "end": 1712842200,
                            "start": 1712822400,
                            "gmtoffset": -14400
                        },
                        "regular": {
                            "timezone": "EDT",
                            "end": 1712865600,
                            "start": 1712842200,
                            "gmtoffset": -14400
                        },
                        "post": {
                            "timezone": "EDT",
                            "end": 1712880000,
                            "start": 1712865600,
                            "gmtoffset": -14400
                        }
                    },
                    "dataGranularity": "1wk",
                    "range": "",
                    "validRanges": [
                        "1d",
                        "5d",
                        "1mo",
                        "3mo",
                        "6mo",
                        "1y",
                        "2y",
                        "5y",
                        "10y",
                        "ytd",
                        "max"
                    ]
                },
                "timestamp": [
                    1704085200,
                    1704690000,
                    1705294800,
                    1705899600,
                    1706504400,
                    1707109200,
                    1707714000,
                    1708318800,
                    1708923600,
                    1709528400,
                    1710129600,
                    1710734400,
                    1711339200
                ],
                "indicators": {
                    "quote": [
                        {
                            "low": [
                                180.1699981689453,
                                181.5,
                                180.3000030517578,
                                191.94000244140625,
                                179.25,
                                185.83999633789062,
                                181.35000610351562,
                                180.0,
                                177.3800048828125,
                                168.49000549316406,
                                170.2899932861328,
                                170.05999755859375,
                                169.4499969482422
                            ],
                            "high": [
                                188.44000244140625,
                                187.0500030517578,
                                191.9499969482422,
                                196.3800048828125,
                                192.1999969482422,
                                191.0500030517578,
                                188.6699981689453,
                                185.0399932861328,
                                183.9199981689453,
                                176.89999389648438,
                                174.3800048828125,
                                178.6699981689453,
                                173.60000610351562
                            ],
                            "close": [
                                181.17999267578125,
                                185.9199981689453,
                                191.55999755859375,
                                192.4199981689453,
                                185.85000610351562,
                                188.85000610351562,
                                182.30999755859375,
                                182.52000427246094,
                                179.66000366210938,
                                170.72999572753906,
                                172.6199951171875,
                                172.27999877929688,
                                171.47999572753906
                            ],
                            "open": [
                                187.14999389648438,
                                182.08999633789062,
                                182.16000366210938,
                                192.3000030517578,
                                192.00999450683594,
                                188.14999389648438,
                                188.4199981689453,
                                181.7899932861328,
                                182.24000549316406,
                                176.14999389648438,
                                172.94000244140625,
                                175.57000732421875,
                                170.57000732421875
                            ],
                            "volume": [
                                275190100,
                                238352300,
                                259667200,
                                255536900,
                                325876200,
                                252715800,
                                268077800,
                                192607200,
                                354310800,
                                393109900,
                                367031800,
                                361530400,
                                237622700
                            ]
                        }
                    ],
                    "adjclose": [
                        {
                            "adjclose": [
                                180.9490966796875,
                                185.6830596923828,
                                191.3158721923828,
                                192.17477416992188,
                                185.6131591796875,
                                188.6093292236328,
                                182.30999755859375,
                                182.52000427246094,
                                179.66000366210938,
                                170.72999572753906,
                                172.6199951171875,
                                172.27999877929688,
                                171.47999572753906
                            ]
                        }
                    ]
                }
            }
        ],
        "error": null
    }
}
Yahoo Japan
The quantmod follows API from Yahoo Japan as well. This option scrapes Yahoo Japan Finance pages. The code inputs informations to the URL and puts as parameters. The request comes back as HTML and the code extracts the financial data.
In the GitHub,
"getSymbols.yahooj" <-
    function(Symbols, env=parent.frame(), return.class='xts', index.class="Date",
             from='2007-01-01',
             to=Sys.Date(),
             ...)

#====================================================================================#

	yahoo.URL <- "https://finance.yahoo.co.jp/quote/"

	   while (TRUE) {
	      URL <- paste0(yahoo.URL, Symbols.name, "/history?")
	      URL <- paste0(URL, "from=", from.str, "&to=", to.str, "&timeFrame=d&page=", page)

	      fdoc <- xml2::read_html(URL)
Request https://finance.yahoo.co.jp/quote/IBM/history?from=20240101&to=20240331&timeFrame=d&page=1
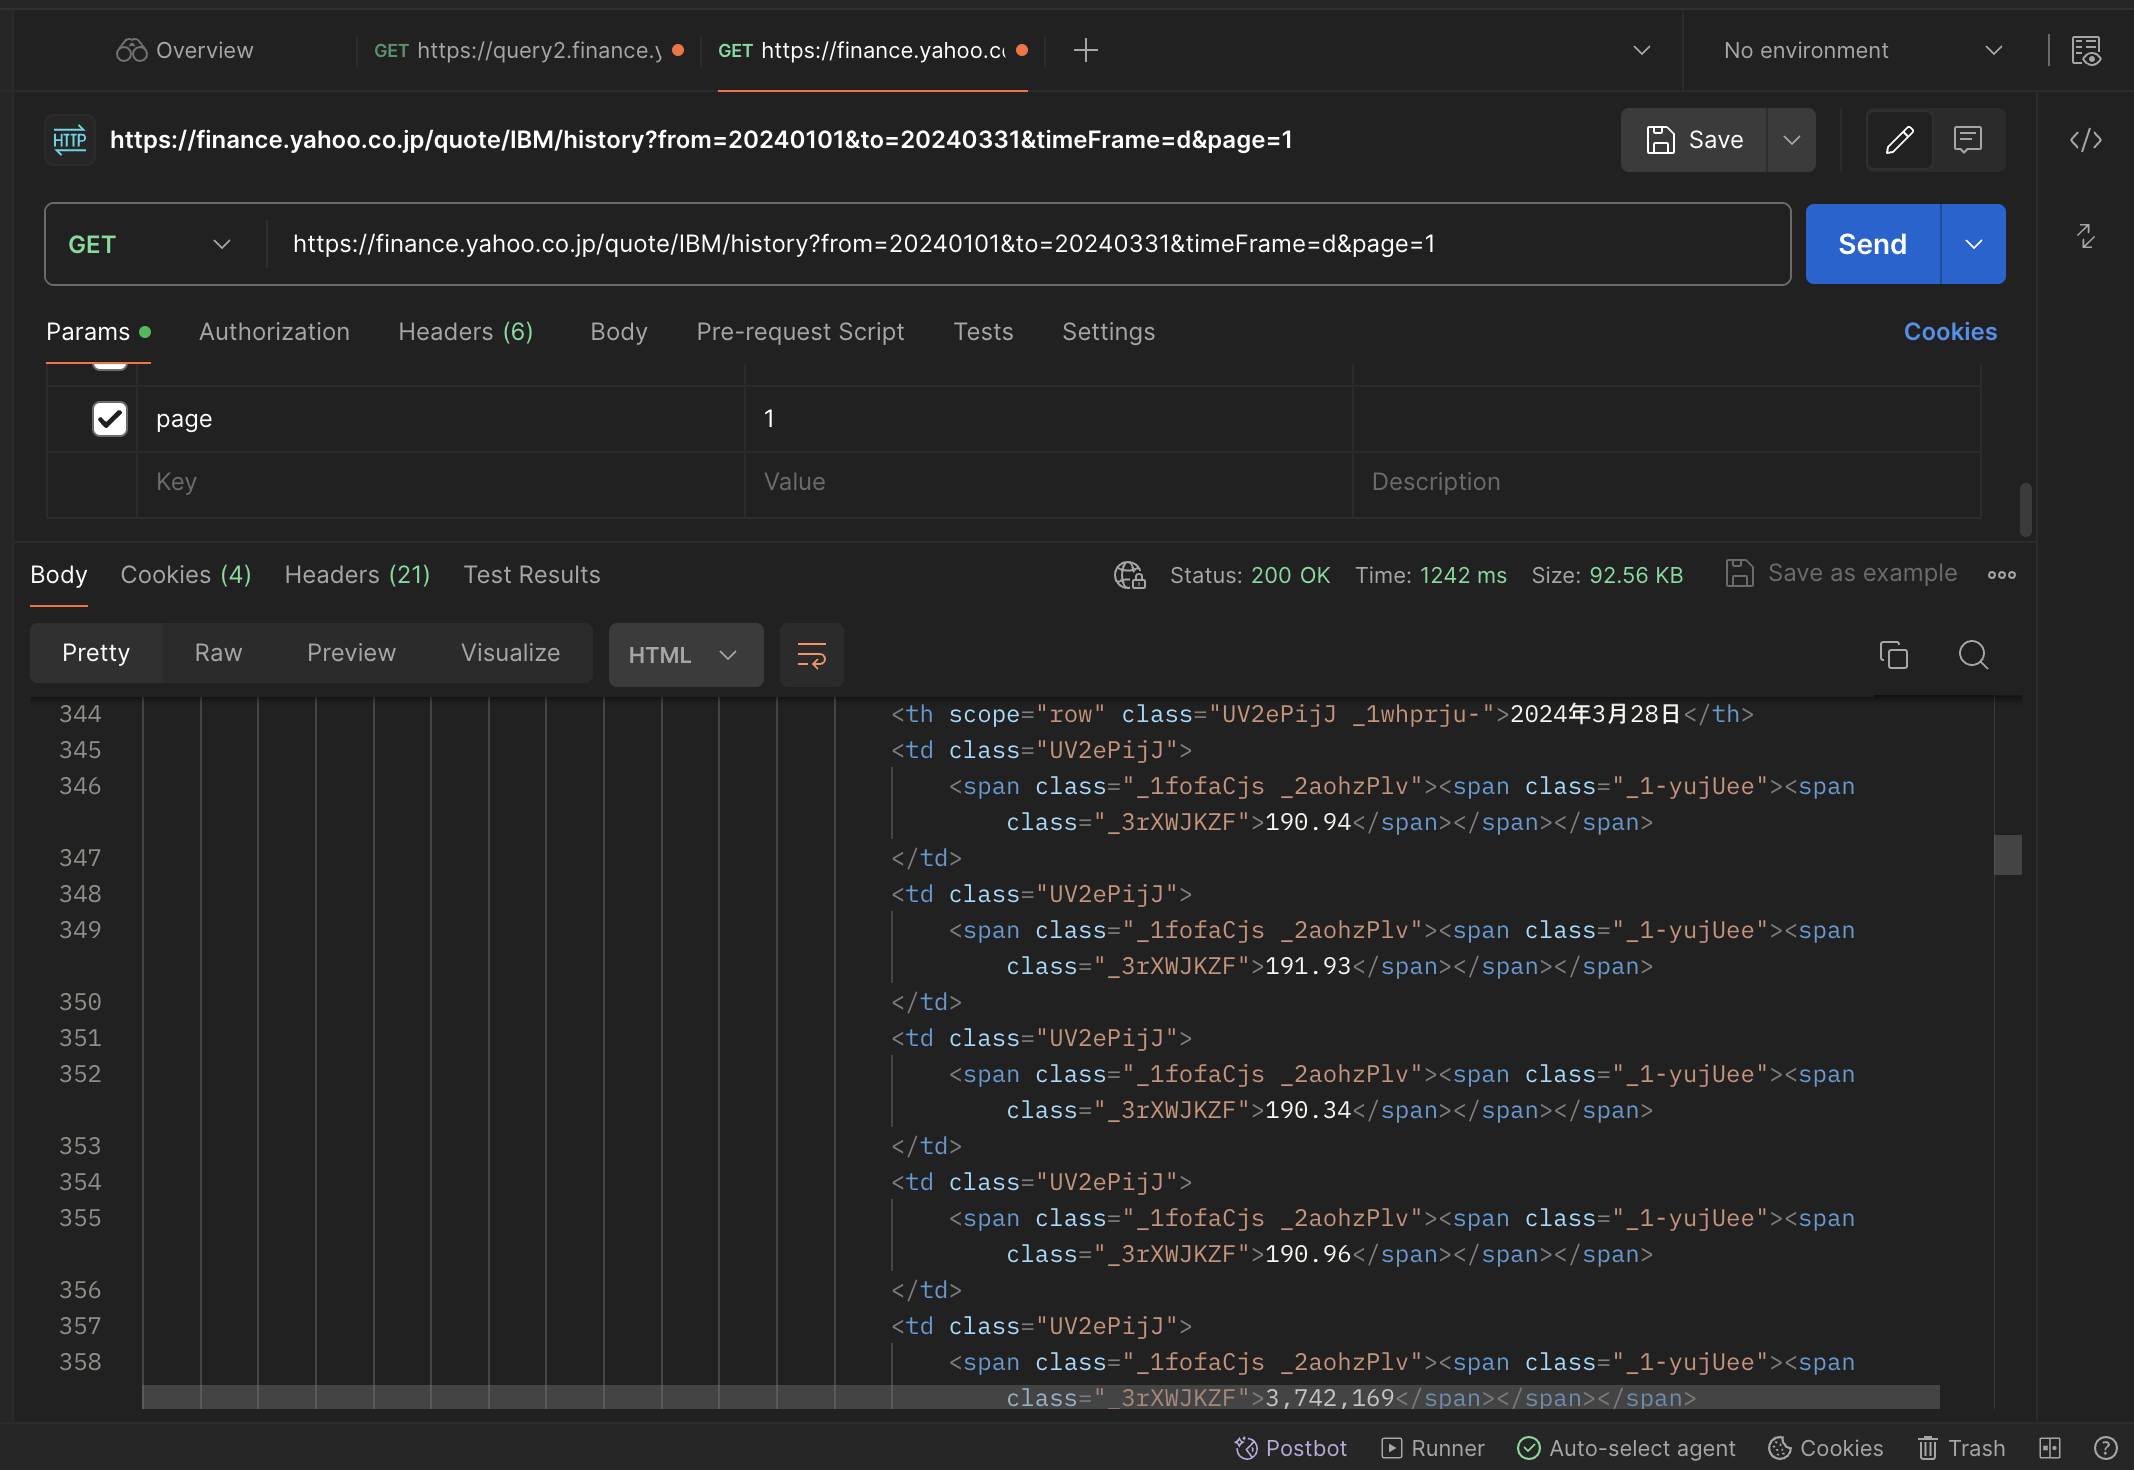
The actual page looks like image below.
Bloomberg API
The quantmod does covers data from Bloomberg. It uses RBloomberg in order to communicate with Bloomberg Open API. The other way to calling Bloomberg API is to use Rblpapi.
The quantmod does not support Bloomberg data sorsce anymore. (2024/04/14)
OANDA
OANDA is a FX trading company which offers currency solutions for both retail and corporate clients. It provides FX API for developers.
In the GitHub,
`getSymbols.oanda` <-
function(Symbols,env,return.class='xts',
from=Sys.Date()-179,
to=Sys.Date(),
...) {
#====================================================================================#
if(verbose) cat("downloading ",Symbols.name,".....")
# throw warning, but return as much data as possible
if(from < Sys.Date() - 180) {
if(isTRUE(warnings)) {
warning("Oanda only provides historical data for the past 180 days.",
" Symbol: ", Symbols[[i]])
}
}
oanda.URL <- paste0("https://fxds-hcc.oanda.com/api/data/update",
"?&source=OANDA&adjustment=0",
"&base_currency=", currency.pair[1],
"&start_date=", from,
"&end_date=", to,
"&period=daily",
"&price=mid",
"&view=table",
""e_currency_0=", currency.pair[2])
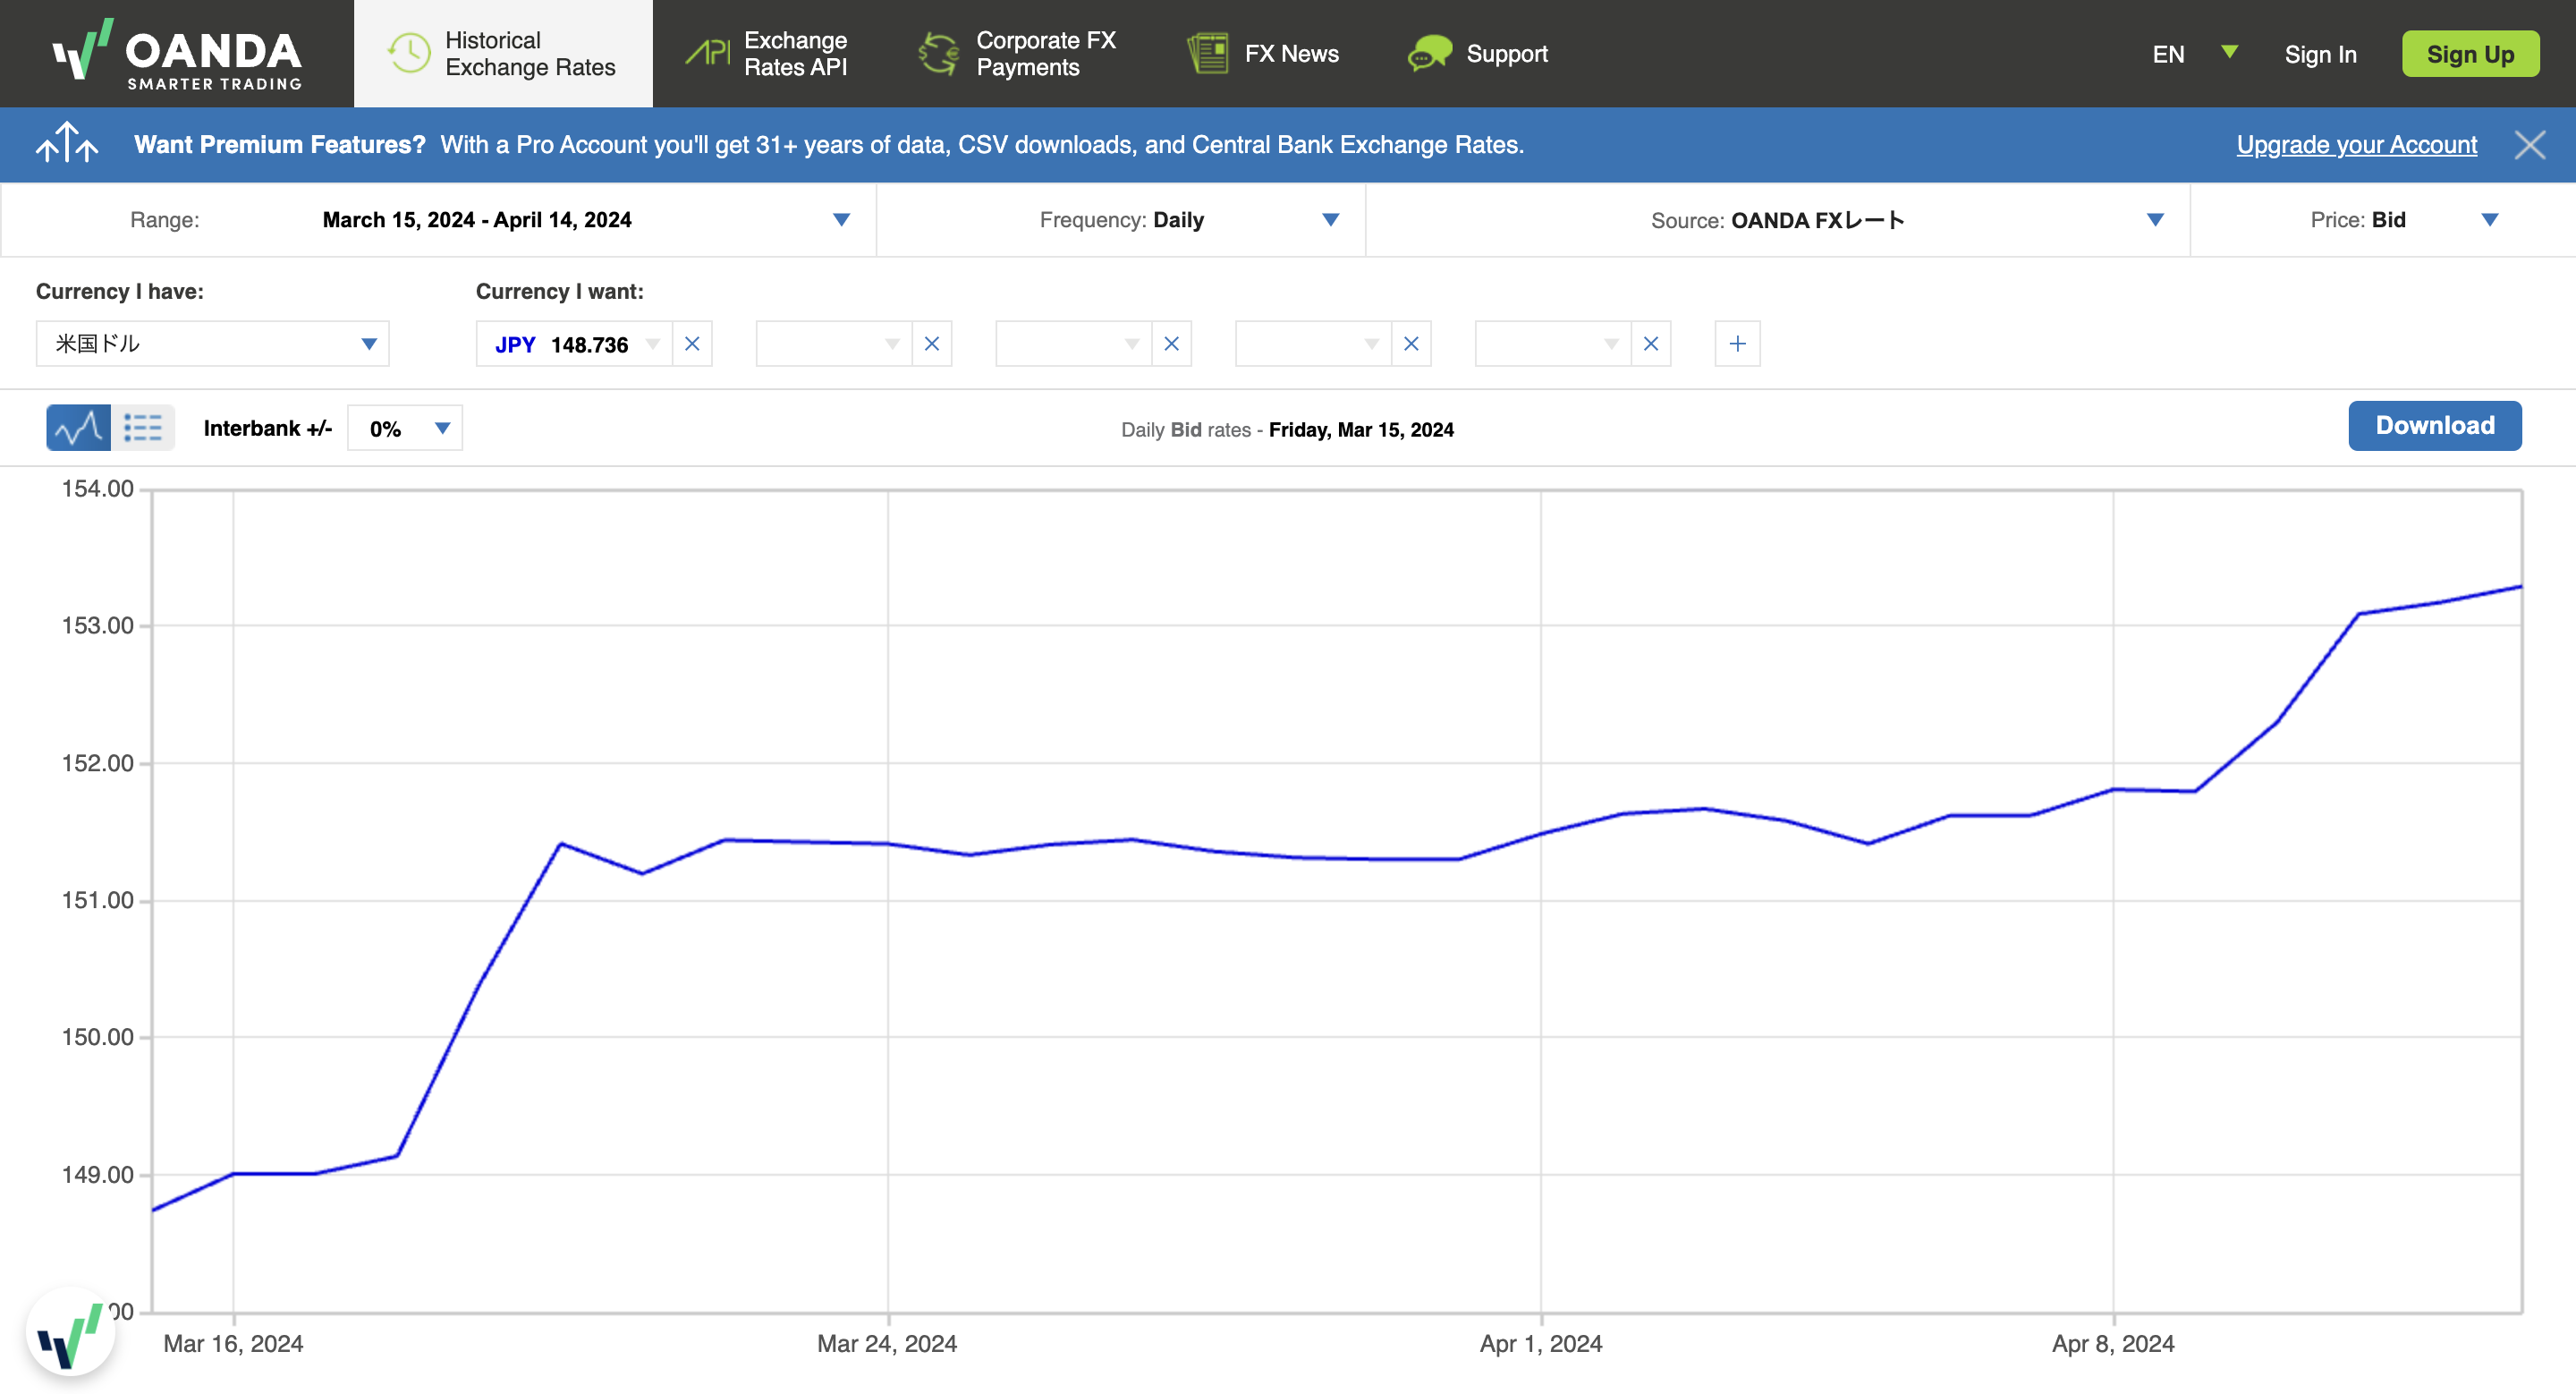
By looking at the code, the OANDA does not support the access to the data for past 180 days. So I checked GUI version of the data source and found out that we do not have access to the data that is order than 180 days. However, I also find out that if we update our account to the Pro membership, it allows us to access to 31+ years of historical data.

ALPHA VANTAGE
ALPHA VANTAGE is one of the most famous free finance API providers. In order to call the quantmod package, we need a free access key that provides access to the 100+ data source but 25 request per day. So if you need more request limit from it, you should sign up for the premium membership.
getSymbols.av <- function(Symbols, env, api.key,
                          return.class="xts",
                          periodicity="daily",
                          adjusted=FALSE,
                          interval="1min",
                          output.size="compact",
                          data.type="json",
                          ...)
Params
| Params | Description |
|---|---|
| Symbols | ticker symbol. CHAR |
| periodicity | Period of the data point["daily","weekly", "monthly","intraday"] |
| adjusted | By default, adjusted=true and the output time series is adjusted by historical split and dividend events. Set adjusted=false to query raw (as-traded) intraday values. -https://www.alphavantage.co/documentation/ |
| interval | Interval of data point ["1min","5min","15min","30min","60min”] |
| output.size | By default, outputsize=compact. Strings compact and full are accepted with the following specifications: compact returns only the latest 100 data points in the intraday time series; full returns trailing 30 days of the most recent intraday data if the month parameter (see above) is not specified, or the full intraday data for a specific month in history if the month parameter is specified. The "compact" option is recommended if you would like to reduce the data size of each API call. - https://www.alphavantage.co/documentation/ |
Tiingo
Tiingo is the API backing analytics platform. It also requires API key to access to the data. The plans are below. For more information please visit pricing Tiing.
Plans
| Free | $30/month | |
|---|---|---|
| Unique Symbols per Month | 500 | 89,437 |
| Max Requests Per Hour | 50 | 10,000 |
| Max Requests Per Da | 1000 | 100,000 |
In the GitHub for quantmod,
getSymbols.tiingo <- function(Symbols, env, api.key,
                              return.class="xts",
                              periodicity="daily",
                              adjust=FALSE,
                              from='2007-01-01',
                              to=Sys.Date(),
                              ...)
| Parameters | Description |
|---|---|
| Symbols | ticker symbol. CHAR |
| periodicity | Period of the data point["daily", "weekly", "monthly", "annually”] |
| adjusted | The adjustment methodology follows the standard method set forth by "The Center for Research in Security Prices" (CRSP) in this document: http://www.crsp.com/products/documentation/crsp-calculations. This methodology incorporates both split and dividend adjustments. Boolean |
In conclusion, quantmod offers a robust and versatile framework for quantitative financial modeling and trading in R. By integrating a wide range of APIs from various financial data providers like Yahoo Finance, OANDA, ALPHA VANTAGE, and Tiingo, quantmod allows users to access a wealth of financial data for their analysis. Its flexibility in handling not only daily, weekly, and monthly data but also intraday data makes it a valuable tool for both long-term investors and high-frequency traders. The package's focus on simplifying data management and visualization tasks also allows users to concentrate more on the development and testing of trading strategies. However, it is important to note the limitations and requirements of the integrated APIs, such as request limits and the need for API keys.