はじめに
日々の作業において、グラフ化しなくてはいけないことは良くありますよね。データを自動的にとってCSV形式に落とすまでは自動化しているのですが、そこからのグラフ化はExcelを使っていたのが現状でした。データの取得はJenkinsで定期的に行っているので、JenkinsのPluginでグラフ化させようと考えました。
JenkinsのPluginでグラフ化といえば Plot Pluginが有名だと思います。
https://wiki.jenkins-ci.org/display/JENKINS/Plot+Plugin
私が調べた限りですが、Plot Pluginは各ビルドの結果を順次表示するもので、私の要望には一致しませんでした。そこで良い機会でもあるので、Plot Pluginのソースコードを多分に参考にして、CSV形式のデータを折れ線グラフで表すPluginの作成を考えました。
Hello World Jenkins Plug-inの作成
基本的に以下のサイトを参考にしました
http://qiita.com/tarappo/items/d8dbe2828ada53979bbf
上記のサイトの以下のコマンドでJavaのバージョンが異なるエラーが私の環境では発生しました。maven3の場合Java 1.7が必要なようです。
$ mvn -cpu hpi:create
.bash_profileに以下を書いて解決
export JAVA_HOME=$(/usr/libexec/java_home -v 1.7)
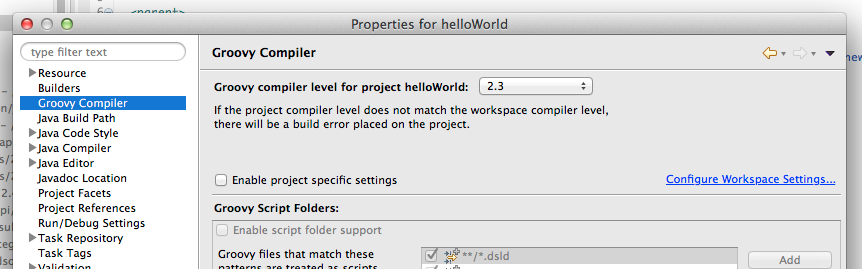
Groovyのバージョン違いのエラーが私の環境では発生
Groovy: compiler mismatch Project level is: 1.8 Workspace level is 2.3
Groovy compiler level expected by the project does not match workspace compiler level.
Go to Project properties -> Groovy compiler to set the Groovy compiler level for this project	helloWorld		helloWorld	Groovy compiler mismatch problem
指示通り Project properties -> Groovy compilerで2.3に変更
このサイトの通りやっていけばちゃんとローカルPC上にJenkinsが起動して、動作しました。

CSV形式のデータを読み込む
先ほどのSample Plug-inを動作させた時点で環境の整備は整っていると思います。では、これからCSV形式のデータをグラフ化するPlug-inを作成していきたいと思います。グラフ化の前にWorkspaceにあるCSV形式のデータを読んで、Consoleに出力するPlug-inを作成しようと思います。
新しくプラグインを作成するために以下のコマンドを打ちます。
$ mvn -U org.jenkins-ci.tools:maven-hpi-plugin:create
$ mvn -DdownloadSources=true -DdownloadJavadocs=true -DoutputDirectory=target/eclipse-classes eclipse:eclipse
最終的にイメージしているジョブのイメージは、なんらかのスクリプトで作成したCSVデータをグラフ化するためのPlug-inです。よって、"ビルド後"の処理でCSVファイルをグラフ化することが望ましいです。先ほどの例は"ビルド"を拡張したPlug-inでしたが、"ビルド後"の処理の場合は以下のRecorderクラスを継承して作成します。
Recoderを継承したCsvPlotPublisherクラスのソースコードは以下になります。
パラメーターとしてCSVファイル名を受け取り、ファイルパスを記録しています。
public class CsvPlotPublisher extends Recorder implements SimpleBuildStep {
    private final String mFileName;

    private FilePath mFilePath;

    @DataBoundConstructor
    public CsvPlotPublisher(String fileName) {
        mFileName = fileName;
    }

    public String getFileName() {
        return mFileName;
    }

    public FilePath getFilePath() {
        return mFilePath;
    }

    @Override
    public BuildStepMonitor getRequiredMonitorService() {
        return BuildStepMonitor.NONE;
    }

    @Override
    public Action getProjectAction(AbstractProject<?, ?> project) {
        return new CsvPlotAction(project, this);
    }

    @Override
    public void perform(Run<?,?> build, FilePath workspace, Launcher launcher, TaskListener listener) {
        listener.getLogger().println("CSV plot starting ... " + workspace);
        mFilePath = new FilePath(workspace, mFileName);
    }

    @Extension
    public static final class DescriptorImpl extends BuildStepDescriptor<Publisher> {
        public DescriptorImpl() {
            load();
        }

        public FormValidation doCheckFileName(@QueryParameter String value)
                throws IOException, ServletException {
            if (value.length() == 0) {
                return FormValidation.error("Please set a file name");
            }
            return FormValidation.ok();
        }

        public boolean isApplicable(Class<? extends AbstractProject> aClass) {
            return true;
        }

        public String getDisplayName() {
            return "CSV plot";
        }

        @Override
        public boolean configure(StaplerRequest req, JSONObject formData) throws FormException {
            save();
            return super.configure(req,formData);
        }

        public boolean getUseFrench() {
            return false;
        }
    }
パラメーターを受けるためには、config.jellyに記述をする必要があります。Jenkinsプラグインの場合、ファイルの置き場所が非常に重要です。パッケージ名とファイルパスが一致する必要があります。
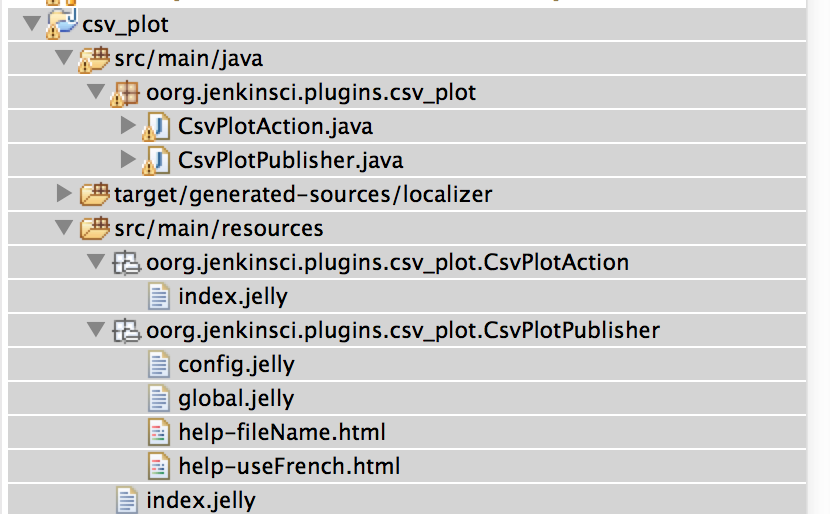
config.jellyの中身は以下のような形になります。
<?jelly escape-by-default='true'?>
<j:jelly xmlns:j="jelly:core" xmlns:st="jelly:stapler" xmlns:d="jelly:define" xmlns:l="/lib/layout" xmlns:t="/lib/hudson" xmlns:f="/lib/form">
  <!--
    This jelly script is used for per-project configuration.

    See global.jelly for a general discussion about jelly script.
  -->

  <f:entry title="File Name" field="fileName">
    <f:textbox />
  </f:entry>
</j:jelly>
これでビルド後の追加で以下のようにパラメーター指定が可能になります

次にCSVファイルを読み込んで出力する部分ですが、これには以下のActionというクラスを継承します。
これにより以下のように左側のメニューが出せます。このメニューがActionにあたります。
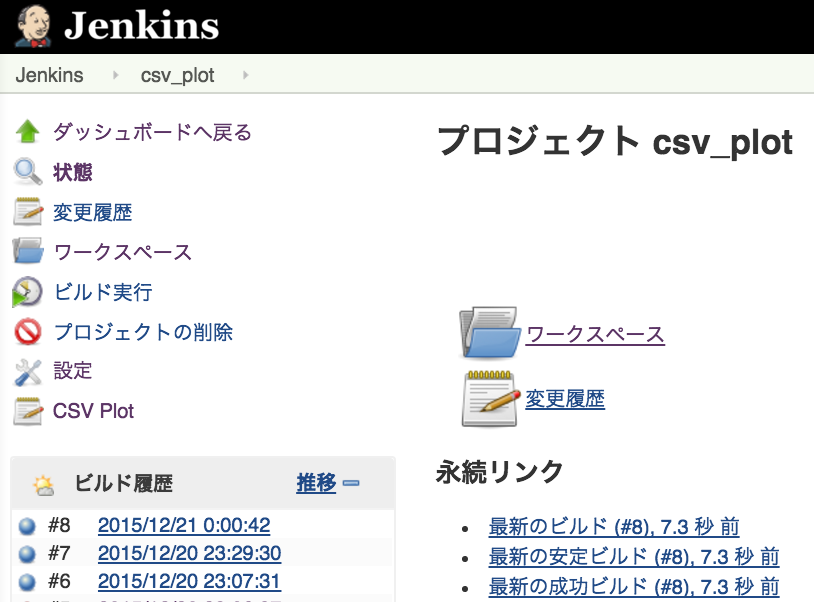
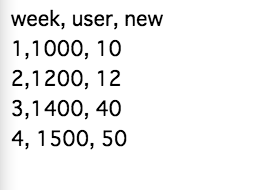
CSV Plotを押すと単純にCSVの中身を表示したViewが表示されます。
public class CsvPlotAction implements Action {
    private final AbstractProject<?, ?> mProject;

    private final CsvPlotPublisher mPublisher;

    public CsvPlotAction(AbstractProject<?, ?> project, CsvPlotPublisher publisher) {
        mProject = project;
        mPublisher = publisher;
    }

    @Override
    public String getIconFileName() {
        return "notepad.png";
    }

    @Override
    public String getDisplayName() {
        return "CSV Plot";
    }

    @Override
    public String getUrlName() {
        return "csv_plot";
    }

    /* Called from index.jelly*/
    public String getResult() {
        FilePath filePath = mPublisher.getFilePath();
        if (filePath == null) {
            return "File not found";
        }
        String result = "";
        try {
            result = filePath.readToString();
        } catch (IOException e) {
        } catch (InterruptedException e) {
        }
        return result;
    }
}
index.jelly
<j:jelly xmlns:j="jelly:core" xmlns:st="jelly:stapler" xmlns:d="jelly:define" xmlns:l="/lib/layout"
         xmlns:t="/lib/hudson" xmlns:f="/lib/form">
    ${it.result}
</j:jelly>
次回
以外にさっくりグラフ化するまでは力不足のためできませんでした。ただ、だいたいのところは見えているので、次回にグラフ化を行います。