概要
import matplotlib.pyplot as plt
plt.style.use('ggplot')
の見た目が綺麗で、初めてstyleを指定したので、'ggplot'について簡単にまとめる。
環境
Python 3.10.0
matplotlib==3.5.2
詳細
$ python --version
Python 3.10.0
$ jupyter --version
Selected Jupyter core packages...
IPython          : 8.4.0
ipykernel        : 6.13.0
ipywidgets       : not installed
jupyter_client   : 7.3.2
jupyter_core     : 4.10.0
jupyter_server   : not installed
jupyterlab       : not installed
nbclient         : 0.6.4
nbconvert        : 6.5.0
nbformat         : 5.4.0
notebook         : 6.4.11
qtconsole        : not installed
traitlets        : 5.2.2
$ pip freeze | grep matplotlib
japanize-matplotlib==1.1.3
matplotlib==3.5.2
matplotlib-inline==0.1.3
内容
defaultとの比較
出典より
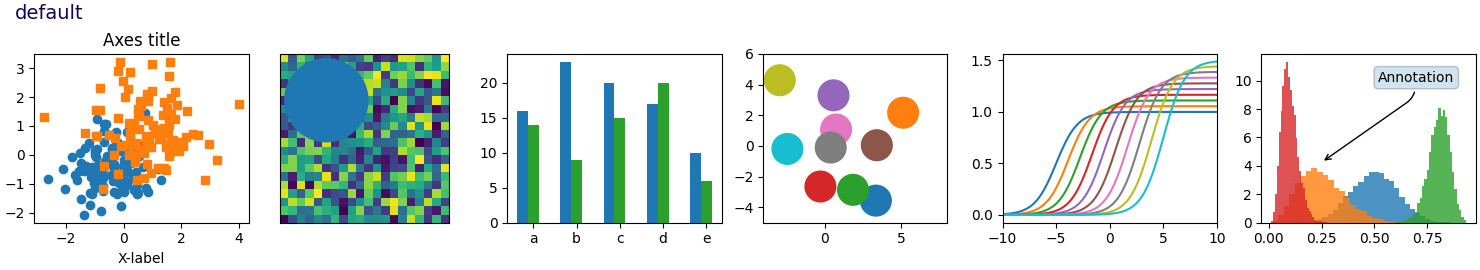
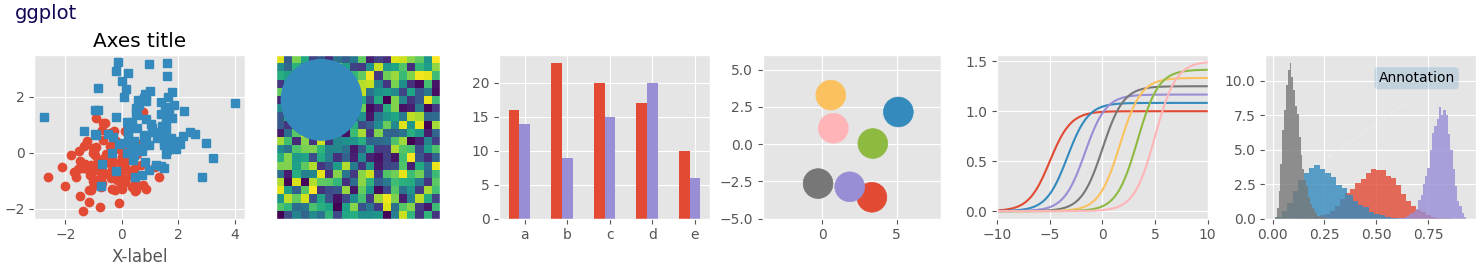
(元ページには他の例もあり)
少し落ち着いて見える気がする。
選択の仕方
styleの指定
import matplotlib.pyplot as plt
plt.style.use('ggplot')
ggplotとは
元々は、統計プログラミング言語Rのデータ資格かパッケージであった? [see.]名前はggplot2のようである。
ggplot2 is a system for declaratively creating graphics, based on The Grammar of Graphics. (https://github.com/tidyverse/ggplot2)
設定の覗き込み
設定を覗き込む
>>> plt.style.library['ggplot']
RcParams({'axes.axisbelow': True,
          'axes.edgecolor': 'white',
          'axes.facecolor': '#E5E5E5',
          'axes.grid': True,
          'axes.labelcolor': '#555555',
          'axes.labelsize': 'large',
          'axes.linewidth': 1.0,
          'axes.prop_cycle': cycler('color', ['#E24A33', '#348ABD', '#988ED5', '#777777', '#FBC15E', '#8EBA42', '#FFB5B8']),
          'axes.titlesize': 'x-large',
          'figure.edgecolor': '0.50',
          'figure.facecolor': 'white',
          'font.size': 10.0,
          'grid.color': 'white',
          'grid.linestyle': '-',
          'patch.antialiased': True,
          'patch.edgecolor': '#EEEEEE',
          'patch.facecolor': '#348ABD',
          'patch.linewidth': 0.5,
          'xtick.color': '#555555',
          'xtick.direction': 'out',
          'ytick.color': '#555555',
          'ytick.direction': 'out'})
rcParamsを上書きしている模様
一瞬はまったこと
ドキュメント(matplotlib.style -matplotlib)では、
この書かれ方をしているが、いざprint(matplotlib.style)とするとエラーになる。
アクセスには、plt.style.つまり、matplotlib.pyplot.style.でアクセスするのが自然。
(__init__.pyの設定でこのような動作になることは知っているし、別に構わないと思う)
まだ分からないこと
現在のスタイルの取得方法
感想
落ち着いた色合いなので、使っていきたい。