概要
matplotlibのGalleryをのんびり見よう。
私個人に分かりやすいようにまとめたりしながら。
環境
Python 3.7
matplotlib 3.4.1
内容
準備
import matplotlib.pyplot as plt
plot
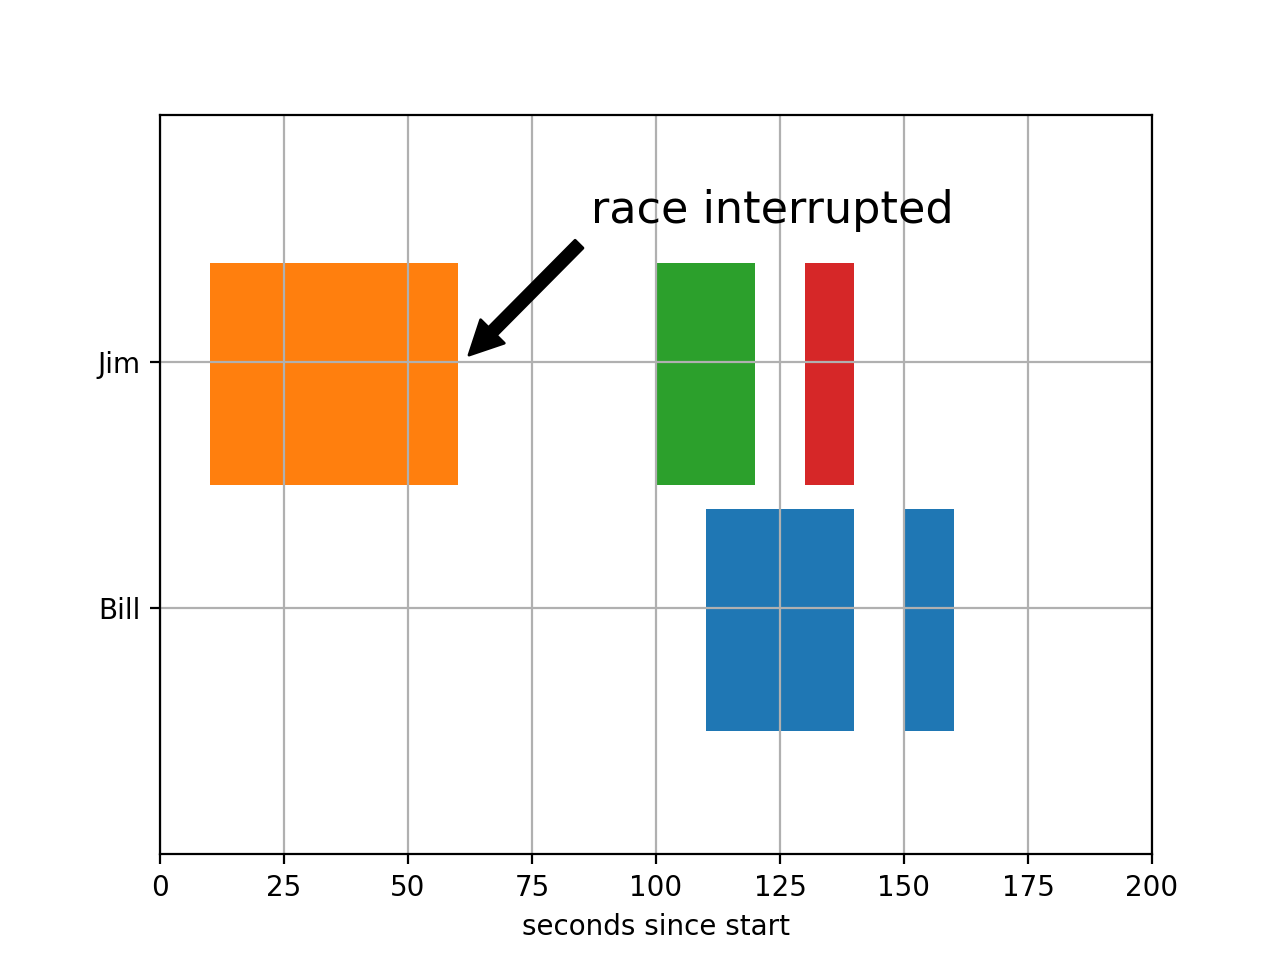
fig, ax = plt.subplots()
ax.broken_barh([(110, 30), (150, 10)], (10, 9), facecolors='tab:blue')
ax.broken_barh([(10, 50), (100, 20), (130, 10)], (20, 9),
               facecolors=('tab:orange', 'tab:green', 'tab:red'))
ax.set_ylim(5, 35)
ax.set_xlim(0, 200)
ax.set_xlabel('seconds since start')
ax.set_yticks([15, 25])
ax.set_yticklabels(['Bill', 'Jim'])
ax.grid(True)
ax.annotate('race interrupted', (61, 25),
            xytext=(0.8, 0.9), textcoords='axes fraction',
            arrowprops=dict(facecolor='black', shrink=0.05),
            fontsize=16,
            horizontalalignment='right', verticalalignment='top')

fig.show()
-
ax.broken_barh()については下記蛇足参照。 -
ax.annotate()についても下記蛇足参照。 -
'tab:blue'はTableau Colorsのこと。(参考)
蛇足
ax.broken_barh(xranges, yrange, *, data=None, **kwargs)
-
xranges: (xmin, xwidth)`のtuple. -
yrange: (ymin, yheight).
ax.annotate(text, xy, *args, **kwargs)
Annotate the point xy with text.
-
text: str テキスト -
xy: (float, float) アノテートする場所の(x, y) -
xytext: (float, float) テキストをおく場所の(x, y)
以下略.
参考にさせていただいた頁
感想
使うと良さそう。
今後
活用していきたい。