概要
matplotlibのGalleryをのんびり見よう。
私個人に分かりやすいようにまとめたりしながら。
環境
Python 3.7
matplotlib 3.4.1
内容
準備
import matplotlib.pyplot as plt
import numpy as np
# Fixing random state for reproducibility
np.random.seed(19680801)
# Example data
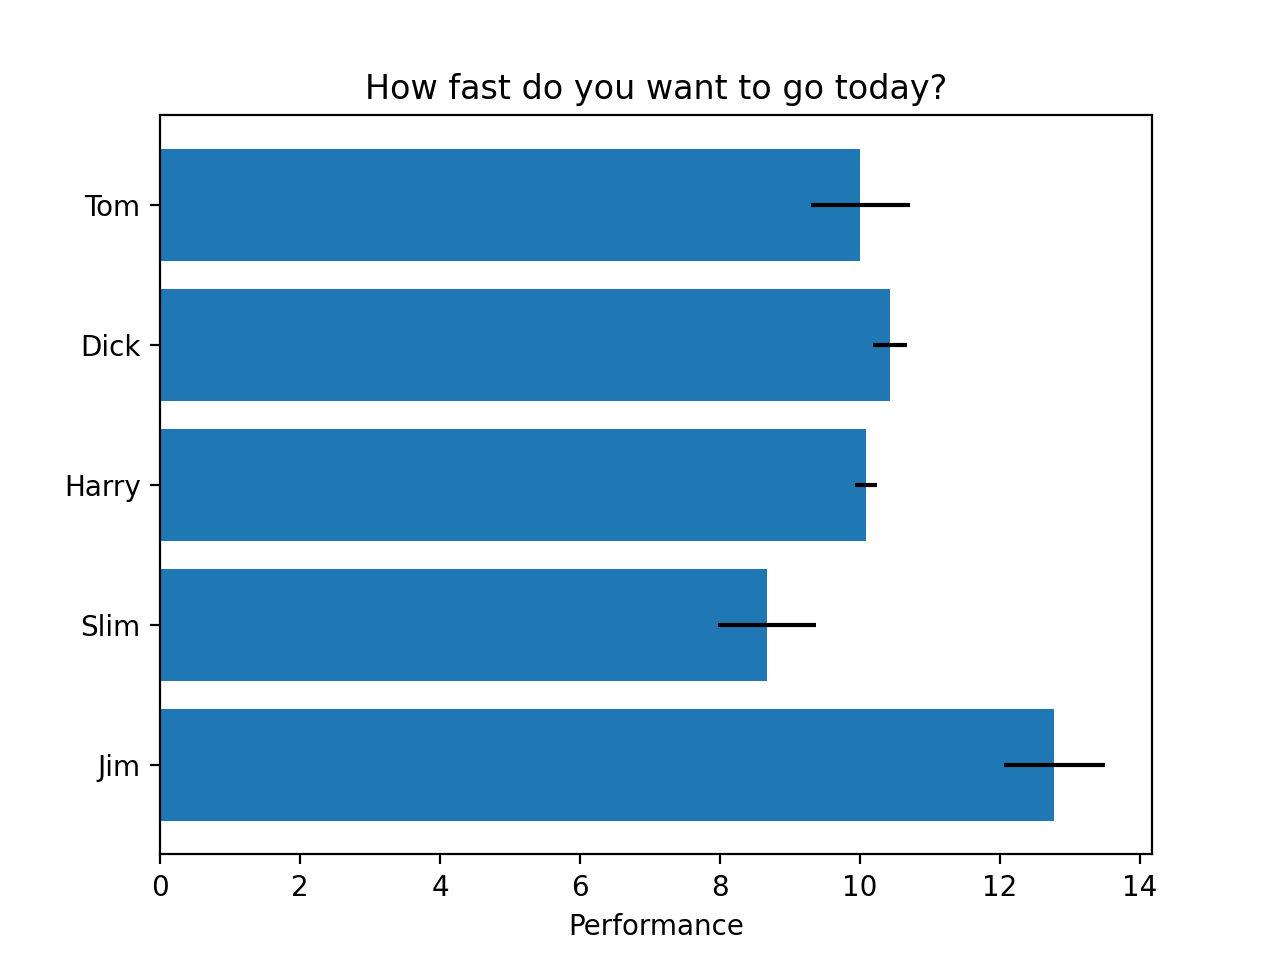
people = ('Tom', 'Dick', 'Harry', 'Slim', 'Jim')
y_pos = np.arange(len(people))
performance = 3 + 10 * np.random.rand(len(people))
error = np.random.rand(len(people))
plot
fig, ax = plt.subplots()

ax.barh(y_pos, performance, xerr=error, align='center')
ax.set_yticks(y_pos)
ax.set_yticklabels(people)
ax.invert_yaxis()  # labels read top-to-bottom
ax.set_xlabel('Performance')
ax.set_title('How fast do you want to go today?')

fig.show()
-
ax.barh()で、horizontal barを描画できる。 -
ax.invert_yaxis()で、y軸を逆転(上下を入れ換えて)いる。
参考にさせていただいた頁
感想
ax.invert_yaxis()は使ったことがなかった。
今後
活用していきたい。