概要
matplotlibのGalleryをのんびり見よう。
私個人に分かりやすいようにまとめたりしながら。
環境
Python 3.7
matplotlib 3.2.1
内容
準備
import matplotlib.pyplot as plt
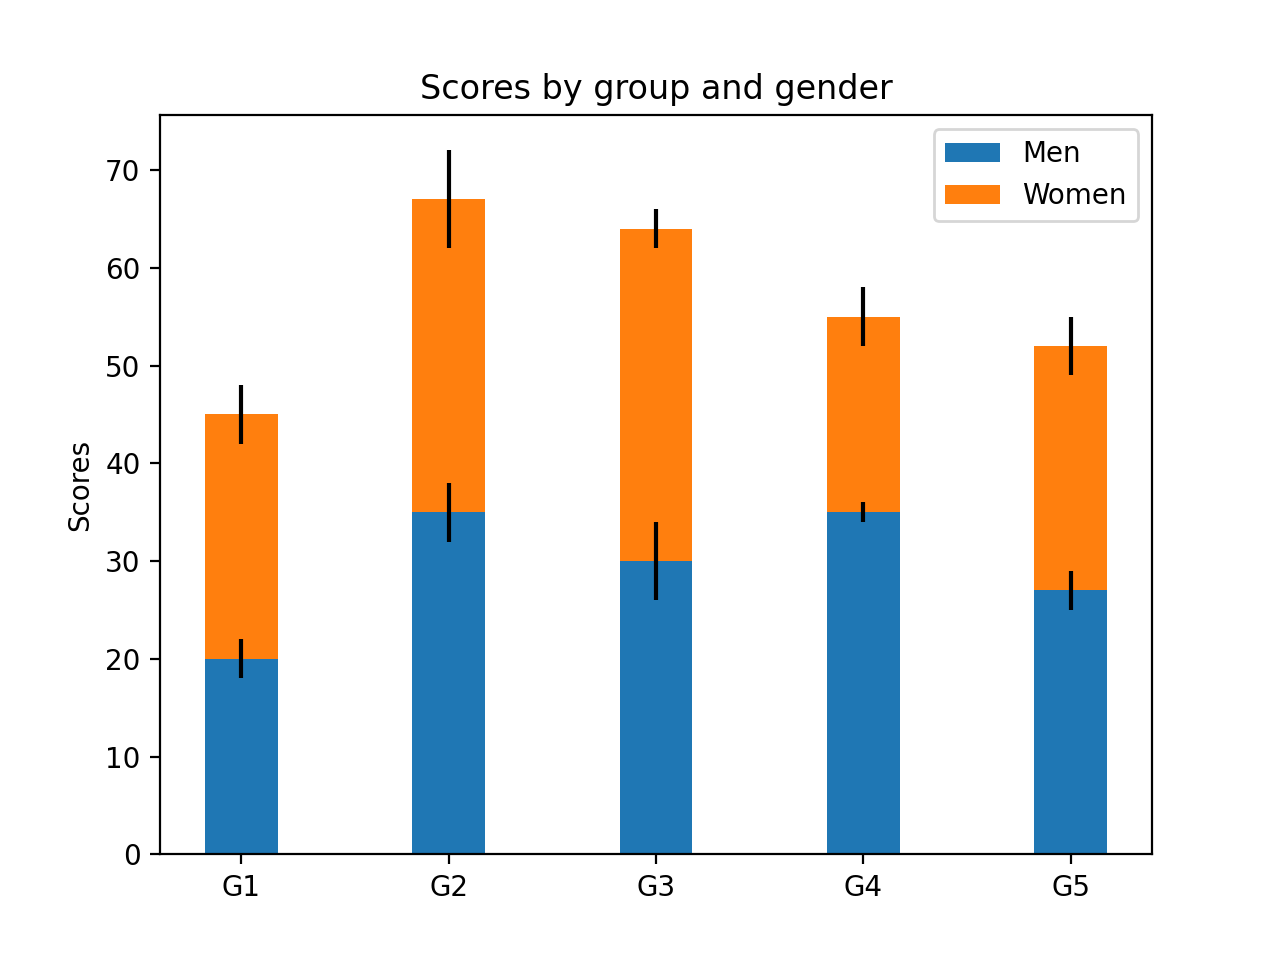
labels = ['G1', 'G2', 'G3', 'G4', 'G5']
men_means = [20, 35, 30, 35, 27]
women_means = [25, 32, 34, 20, 25]
men_std = [2, 3, 4, 1, 2]
women_std = [3, 5, 2, 3, 3]
width = 0.35 # the width of the bars: can also be len(x) sequence
plot
fig, ax = plt.subplots()

ax.bar(labels, men_means, width, yerr=men_std, label='Men')
ax.bar(labels, women_means, width, yerr=women_std, bottom=men_means,
       label='Women')

ax.set_ylabel('Scores')
ax.set_title('Scores by group and gender')
ax.legend()

fig.show()
-
bottom=を指定することで、stacked bar chartができる -
yerr=を指定することで、error barがつけられる
参考にさせていただいた頁
感想
グラフを積み重ねるときに使える。
今後
活用していきたい。