ライブラリをインポートする
import pandas as pd  # データ分析に用いるライブラリ
import matplotlib.pyplot as plt  # グラフ表示に用いるライブラリ
pd.set_option('display.unicode.east_asian_width', True)  # 表示のずれを少し緩和
plt.rcParams['font.family'] = 'IPAexGothic'  # グラフ表示におけるフォントの指定
この4つを毎回、冒頭に記入すること。
データを読み込む
data_path = "./titanic.csv"
df_data = pd.read_csv(data_path,  encoding="utf-8-sig")
data_pathにファイルのパスを指定して、df_dataに読み込んだデータを格納する。
データを確認する
ランダムにいくつか表示させてみる
print(df_data.sample(10))
 データの列は省略されているし、あまり綺麗には表示されない。
データ数を表示してみる
print(df_data.shape)
 縦方向に712行、横方向に10列のデータということ。
データの項目(横方向・列方向)を表示してみる
print(df_data.columns)

ある部分だけ表示してみる
print(df_data.loc[0:10, "年齢"])
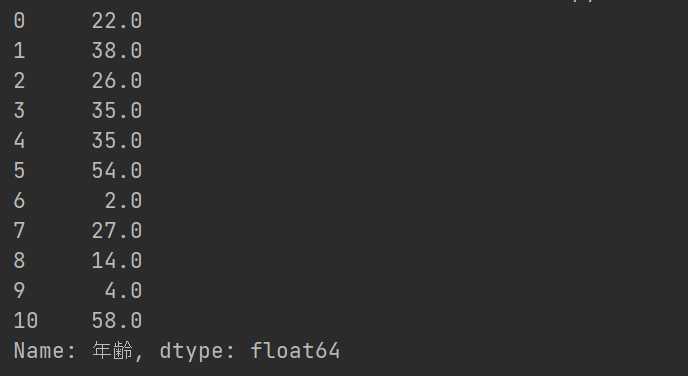
最初の10行の年齢が表示される。
print(df_data.loc[:, "年齢"])
 省略されるが、一応全ての行が表示される。
print(df_data.loc[:, ["性別", "年齢"]])
 リストで指定すれば、複数の列も表示できる(ズレるけど)。
項目の値を全て抽出する
print(df_data.loc[:, "出港地"].unique())
 出港地は3パターンしかないことが分かる。
# データの分析(基本編)
## 簡単な統計量を算出する場合
```python
print(df_data.describe())
```
出港地は3パターンしかないことが分かる。
# データの分析(基本編)
## 簡単な統計量を算出する場合
```python
print(df_data.describe())
```
 数値データの列のみ、`mean`(平均値)や`std`(標準偏差)、`min`(最小値)等が表示される。
条件に合ったデータを表示する場合
mask = df_data["生存状況"] == 1
print(df_data[mask])
 生存した人だけのデータが表示される。
指定する列の値で並べ替える場合
print(df_data.sort_values(by="旅客クラス", ascending=True))
 大きい順にしたい場合は`ascending=False`にする。
特定の列のある値でまとめた平均値等を表示する場合
print(df_data.groupby("旅客クラス").mean())
 `mean()`の他に、`max()`や`min()`等もある。
特定の列の値の頻度を求める場合
print(df_data["旅客クラス"].value_counts(sort=False))

データの分析(組合せ編)
特定の列&値の頻度
print(df_data.loc[:, ["旅客クラス", "生存状況"]].value_counts(sort=False))
 [必要な列のみ表示](#ある部分だけ表示してみる)させて、[それらの値の頻度](#特定の列の値の頻度を求める場合)を表示させている。
条件&並べ替え&特定の列
mask = df_data["生存状況"] == 1
print(df_data[mask].sort_values(by="旅客クラス", ascending=True).loc[:, ["旅客クラス", "運賃"]])
 [条件で絞り込んで](#条件に合ったデータを表示する場合)、[並べ替えて](#指定する列の値で並べ替える場合)、[必要な列のみ表示](#ある部分だけ表示してみる)させている。