はじめに
Pythonを使ってネットワークのパケットを分析してみる。
今回はキャプチャーファイル(tcpdumpの結果)から作ったCSVをPythonで読み込み、通信先ホスト(Destination)別にパケットを集計してグラフ化する。管理下のサーバーの通信先の分析などを想定している。
キャプチャーファイルからCSVを作成する方法はこちらを参照。
前提
- JupyterNotebook
- 適当なtcpdumpから作ったCSVファイル(サンプルではYahooのトップページにアクセスした際のキャプチャーを使用)
必要なモジュールのインポート
今回使用するモジュールをインポートする。
なお、以降は全てJupyterNotebook上で実行している。
import pandas as pd
import matplotlib.pyplot as plt
import numpy as np
CSVの読み込み
CSVをデータフレームdfに読み込む。
df = pd.read_csv('test003.csv', index_col=0)
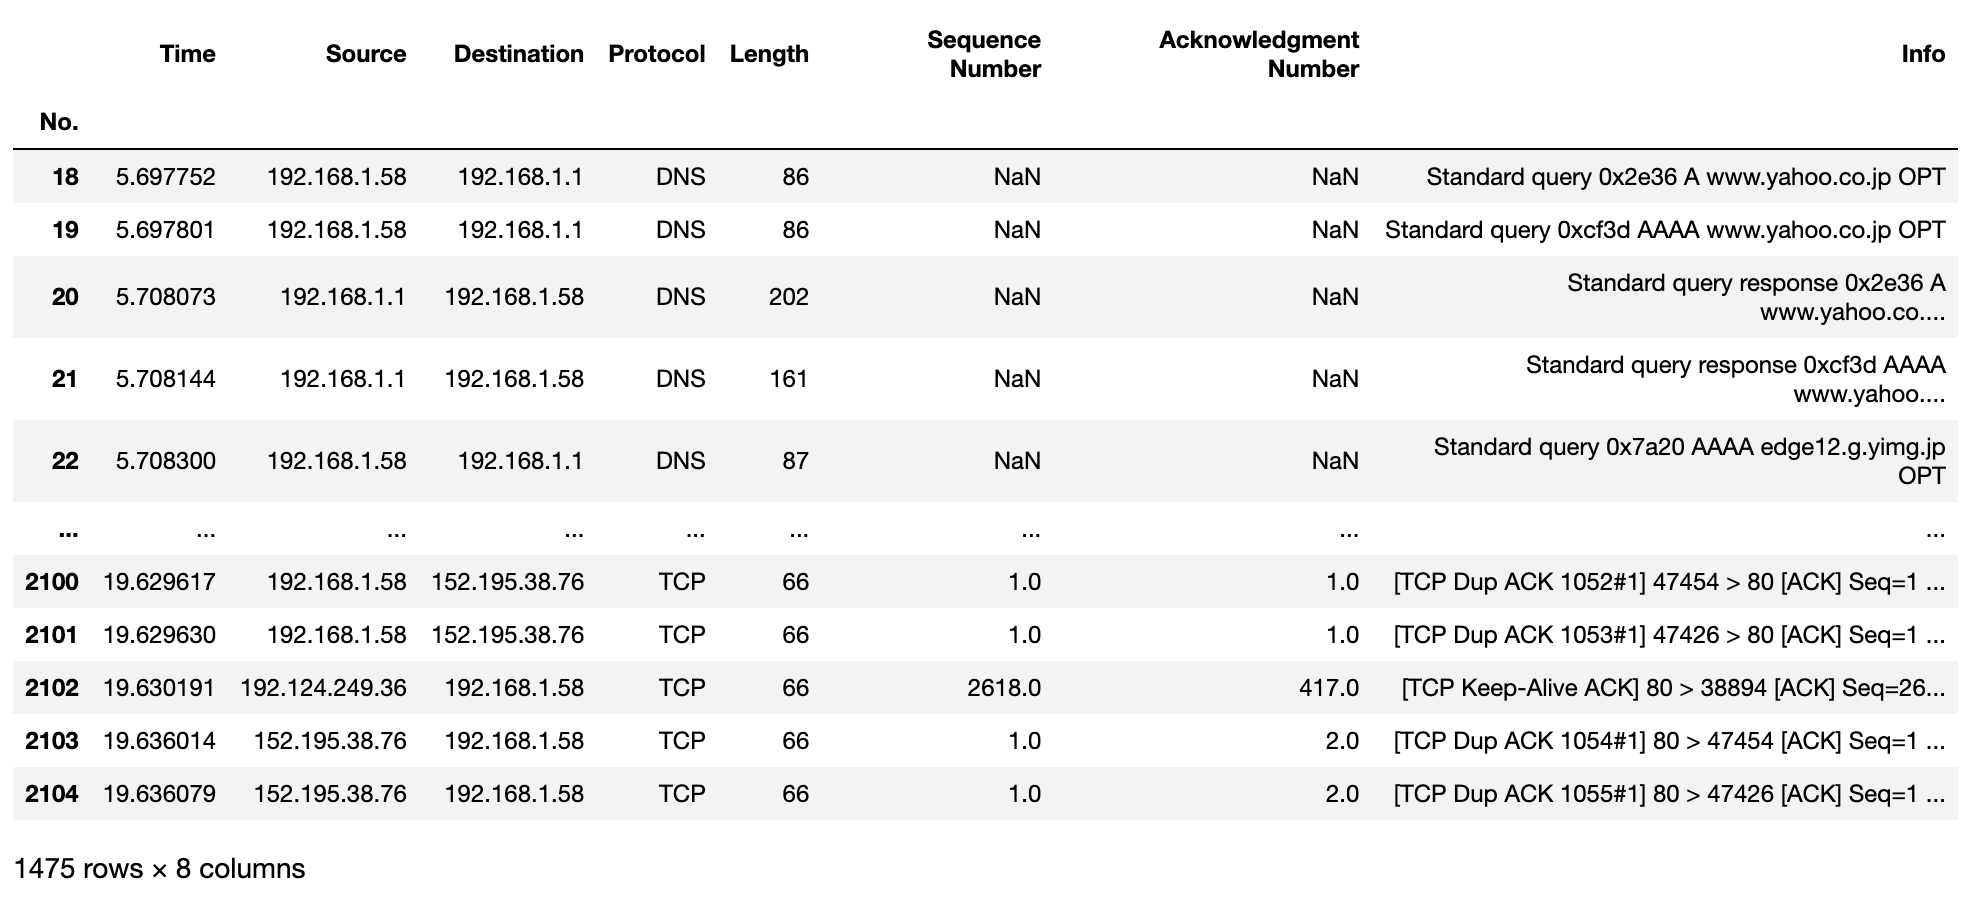
dfの内容を表示してみる。
df
通信先ホスト別(Destination)に集計する
データフレームのDestination列を集計してみる。
df.Destination.value_counts()
結果
Destination
192.168.1.58      735
182.22.25.124     243
183.79.250.251    184
183.79.249.124     93
192.168.1.1        85
54.249.167.126     46
34.149.43.113      19
116.118.230.85     15
103.43.90.21       14
113.52.156.18      11
152.195.38.76       7
192.124.249.36      5
34.120.208.123      5
192.124.249.22      4
34.107.221.82       3
34.117.237.239      2
34.107.243.93       2
34.120.115.102      2
Name: count, dtype: int64
これを新しいデータフレームdf2に入れる。
df2=pd.DataFrame(df.Destination.value_counts())
ここで、192.168.1.58は自分のアドレスであるため削除しておく。
df2.drop(index='192.168.1.58', inplace=True)
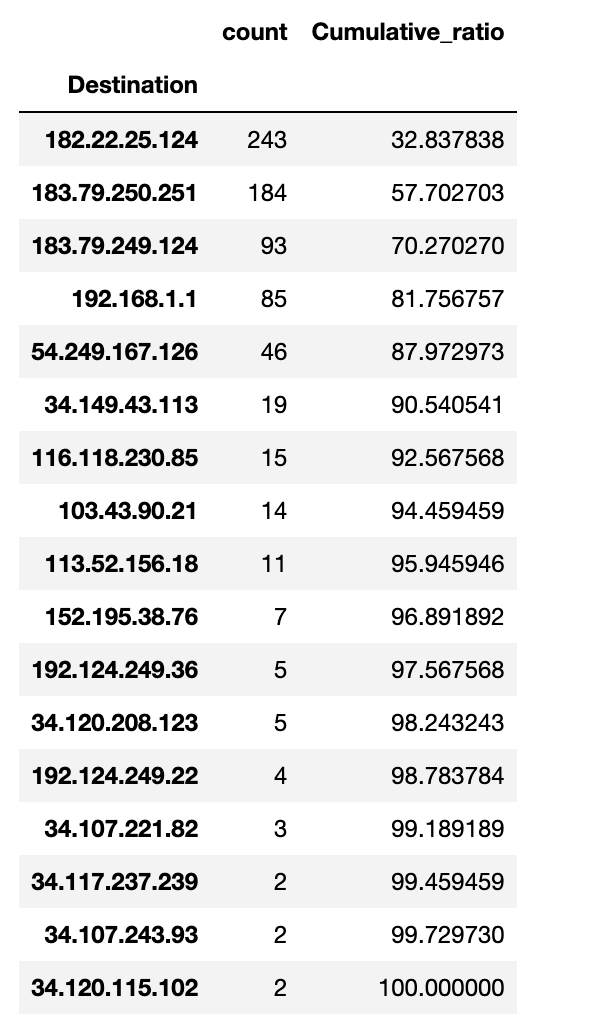
累積比率(Cumulative_ratio)を計算し、df2に列を追加する。
df2["Cumulative_ratio"]=df2['count'].cumsum() / df2["count"].sum() * 100
この時点でのdf2の内容を表示してみる。
df2
パレート図を作成する
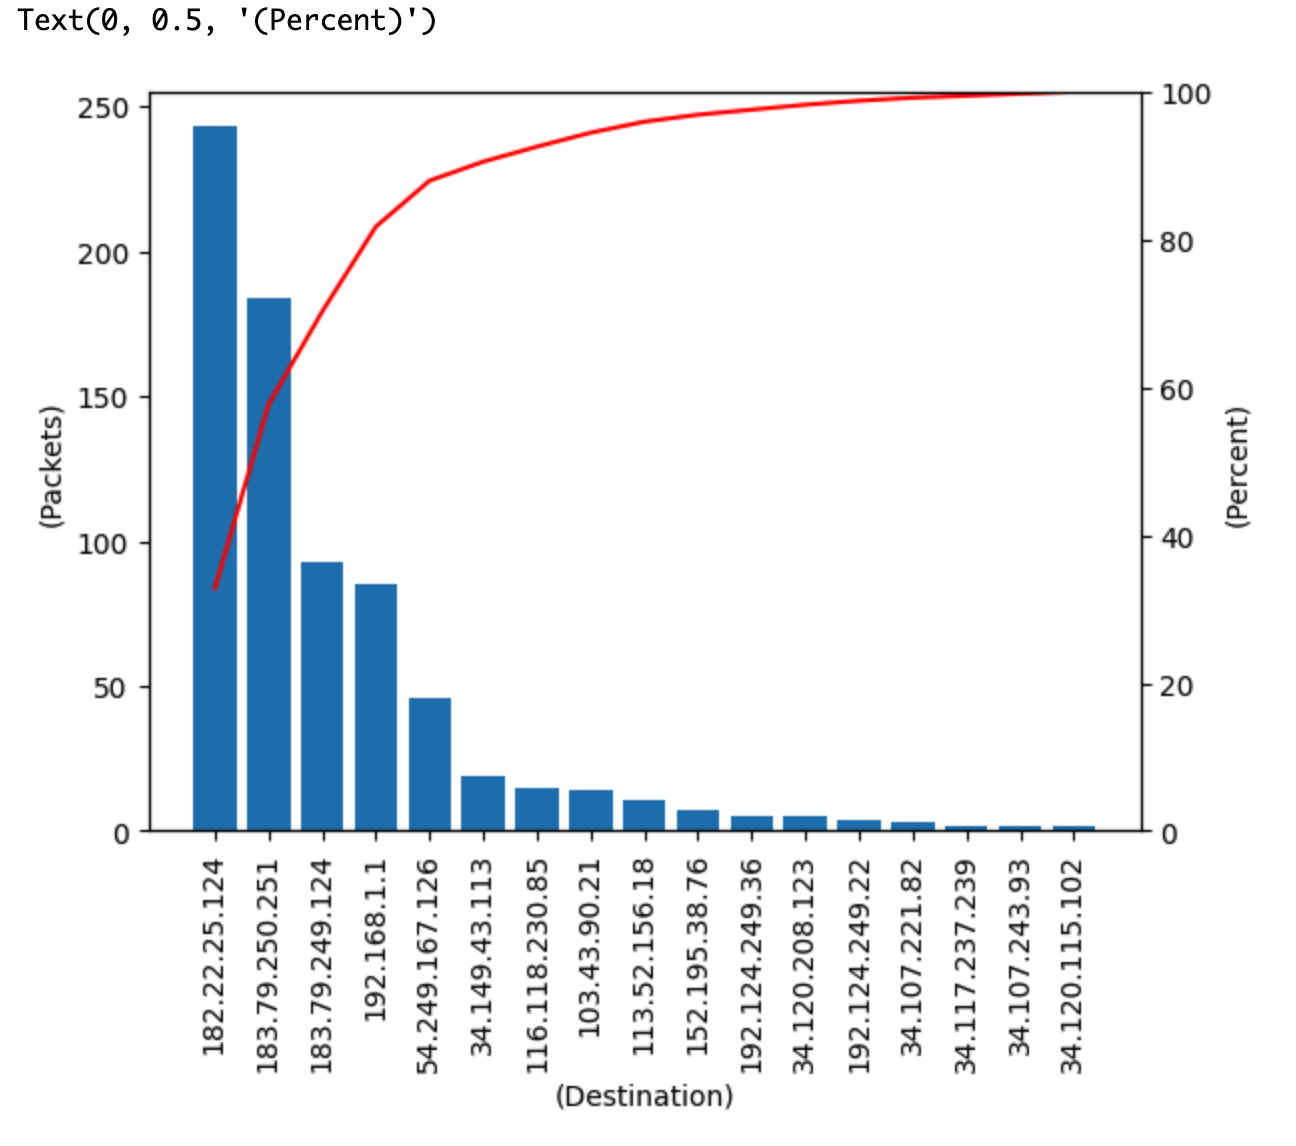
df2の内容をもとにパレート図を描画してみる。
fig = plt.figure()
ax = fig.add_subplot(111)

data_num = len(df2)

ax.bar(range(data_num), df2["count"])
ax.set_xticks(range(data_num))
ax.set_xticklabels(df2.index.tolist(), rotation=90)
ax.set_xlabel("(Destination)")
ax.set_ylabel("(Packets)")

ax_add = ax.twinx()
ax_add.plot(range(data_num), df2["Cumulative_ratio"], color='red')
ax_add.set_ylim([0, 100])
ax_add.set_ylabel("(Percent)")
このように、キャプチャーファイル中の通信先ホストをパケット数が多い順に可視化することができた。
なお、通信元(Source)についても同様にグラフ化できる。
以上。


