はじめに
ネットワークデータって?
ネットワークデータは、ノード(頂点)とエッジ(辺)で構成されるグラフ構造を持つデータです。このデータ構造は、多くの現実世界のシステムをモデル化するのに非常に適しており、ソーシャルネットワーク、通信ネットワーク、交通ネットワーク、生物学的ネットワークなど、さまざまな分野で使用されています。
ネットワークデータの主な特徴
- ノード(Node): 個々のエンティティを表す。人、場所、オブジェクトなど何でも
- エッジ(Edge): 二つのノード間の関係を示す。友情、リンク、相互作用などが該当
- 属性(Attributes): ノードやエッジに追加情報を持たせることができる
- 方向性(Direction): エッジが一方向か双方向かを示し、情報の流れや関係の性質の表現
- 重み(Weight): エッジに重みを設定して、その接続の強さや重要度を数値化する
EDAって?
探索的データ分析(Exploratory Data Analysis、EDA)は、データをさまざまな角度から検証し、主要な傾向、パターン、異常値、またデータ構造の理解を深めるための分析手法です。EDAは、データサイエンスプロジェクトの初期段階で行われ、データに対する直感を形成し、将来の分析やモデリング戦略を形成するのに役立ちます。
EDAの主な目的
- データの要約: データの形状、タイプ、分布を理解
- パターンの発見: データ内の関係性やトレンドを見つけ出す
- 異常値の検出: データセットの中で一般的でない、または期待外れの観測値を特定する
- 仮説生成: データの理解を基にした仮説を作り、さらなる詳細な分析のための基盤を築く
- データのクリーニング: 不足データやエラーのあるデータ点の修正を行う
ネットワークデータに対するEDA
ネットワークデータに対する探索的データ分析(EDA)では、ネットワークの基本的な特性や構造を理解し、データの特徴を可視化し、さらなる分析やモデル構築のための洞察を得ることが目的です。
ネットワークにおける各用語になじみのない方は、こちらの記事がオススメです。
実装例
import networkx as nx
import numpy as np
import matplotlib.pyplot as plt
from networkx.algorithms import bipartite
from collections import Counter
from scipy.stats import linregress
from gudhi import RipsComplex
from ripser import ripser
from persim import plot_diagrams
import matplotlib
#matplotlib.rcParams['text.usetex'] = True
matplotlib.rcParams['text.latex.preamble'] = r'\usepackage{amsmath}'
matplotlib.rcParams['text.usetex'] = False


# ランダムな有向グラフの生成
G = nx.gnp_random_graph(100, 0.05, directed=True)

# ランダムに選択したノードに自己参照ループを追加
num_self_loops = 10
nodes_with_self_loops = np.random.choice(G.nodes(), num_self_loops, replace=False)
G.add_edges_from(zip(nodes_with_self_loops, nodes_with_self_loops))

print("=" * 50)
print("1. ネットワークの概要把握")
print("=" * 50)
print("ノードの数:", G.number_of_nodes())
print("エッジの数:", G.number_of_edges())
print("ネットワークのタイプ:", "無向グラフ" if not G.is_directed() else "有向グラフ")
print("加重グラフ:", "はい" if nx.is_weighted(G) else "いいえ")

print("=" * 50)
print("2. 次数分布の分析")
print("=" * 50)
in_degrees = [d for _, d in G.in_degree()]
out_degrees = [d for _, d in G.out_degree()]

# 次数分布の分析
degrees = [G.degree(n) for n in G.nodes()]
degree_count = Counter(degrees)
deg, cnt = zip(*degree_count.items())

# ログログプロットを作成してべき乗則関係を視覚的に評価
fig, ax = plt.subplots()
ax.bar(deg, cnt, width=0.80, color='b')
ax.set_title("Degree Histogram")
ax.set_xlabel("Degree")
ax.set_ylabel("Frequency")
ax.set_xscale('log')
ax.set_yscale('log')
plt.show()

# 入次数と出次数の分布を可視化
plt.figure(figsize=(8, 4))
plt.subplot(1, 2, 1)
plt.hist(in_degrees, bins=20, density=True, alpha=0.7, color='blue')
plt.xlabel("In-degree")
plt.ylabel("Density")
plt.title("In-degree Distribution")

plt.subplot(1, 2, 2)
plt.hist(out_degrees, bins=20, density=True, alpha=0.7, color='red')
plt.xlabel("Out-degree")
plt.ylabel("Density")
plt.title("Out-degree Distribution")
plt.tight_layout()
plt.show()

# 入次数と出次数のログログプロットを作成してべき乗則関係を視覚的に評価
in_degree_count = Counter(in_degrees)
out_degree_count = Counter(out_degrees)

in_deg, in_cnt = zip(*in_degree_count.items())
out_deg, out_cnt = zip(*out_degree_count.items())

fig, (ax1, ax2) = plt.subplots(1, 2, figsize=(12, 4))

ax1.scatter(in_deg, in_cnt, marker='o', color='blue')
ax1.set_xscale('log')
ax1.set_yscale('log')
ax1.set_xlabel('In-degree')
ax1.set_ylabel('Frequency')
ax1.set_title('In-degree Distribution (log-log)')

ax2.scatter(out_deg, out_cnt, marker='o', color='red')
ax2.set_xscale('log')
ax2.set_yscale('log')
ax2.set_xlabel('Out-degree')
ax2.set_ylabel('Frequency')
ax2.set_title('Out-degree Distribution (log-log)')

plt.tight_layout()
plt.show()

# 線形回帰を用いてべき乗則の傾きを計算
in_log_deg = np.log(list(in_deg))
in_log_cnt = np.log(list(in_cnt))
in_slope, in_intercept, in_r_value, in_p_value, in_std_err = linregress(in_log_deg, in_log_cnt)

out_log_deg = np.log(list(out_deg))
out_log_cnt = np.log(list(out_cnt))
out_slope, out_intercept, out_r_value, out_p_value, out_std_err = linregress(out_log_deg, out_log_cnt)

print("入次数分布のべき乗則の傾き:", in_slope)
print("入次数分布の決定係数:", in_r_value**2)

print("出次数分布のべき乗則の傾き:", out_slope)
print("出次数分布の決定係数:", out_r_value**2)

print("判定結果: 次数分布は" + ("スケールフリー的である" if np.std(in_degrees) > np.mean(in_degrees) or np.std(out_degrees) > np.mean(out_degrees) else "ランダムに近い"))

print("=" * 50)
print("3. 中心性指標の評価")
print("=" * 50)
in_degree_centrality = nx.in_degree_centrality(G)
out_degree_centrality = nx.out_degree_centrality(G)
betweenness_centrality = nx.betweenness_centrality(G)
closeness_centrality = nx.closeness_centrality(G)
eigenvector_centrality = nx.eigenvector_centrality(G)

print("入次数中心性の最大値:", max(in_degree_centrality.values()))
print("出次数中心性の最大値:", max(out_degree_centrality.values()))
print("媒介中心性の最大値:", max(betweenness_centrality.values()))
print("近接中心性の最大値:", max(closeness_centrality.values()))
print("固有ベクトル中心性の最大値:", max(eigenvector_centrality.values()))

print("判定結果: 中心性指標が高いノードが" + ("存在する" if max(in_degree_centrality.values()) > 0.5 or max(out_degree_centrality.values()) > 0.5 or max(betweenness_centrality.values()) > 0.5 or max(closeness_centrality.values()) > 0.5 or max(eigenvector_centrality.values()) > 0.5 else "存在しない"))

print("=" * 50)
print("4. クラスタリング係数とトランジティビティ")
print("=" * 50)
avg_clustering = nx.average_clustering(G)
print("平均クラスタリング係数:", avg_clustering)
print("判定結果: グラフは" + ("クラスター化している" if avg_clustering > 0.5 else "ランダムに近い"))

transitivity = nx.transitivity(G)
print("トランジティビティ:", transitivity)
print("判定結果: グラフは" + ("クラスター化している" if transitivity > 0.5 else "ランダムに近い"))

print("=" * 50)
print("5. コミュニティ検出")
print("=" * 50)
communities = nx.community.greedy_modularity_communities(G)
print("コミュニティの数:", len(communities))
print("判定結果: グラフは" + ("コミュニティ構造を持つ" if len(communities) > 1 else "コミュニティ構造を持たない"))

print("=" * 50)
print("6. ネットワーク可視化")
print("=" * 50)
pos = nx.spring_layout(G)
nx.draw(G, pos, with_labels=True, node_size=50, font_size=8, edge_color='gray', width=0.5, arrowsize=10)
plt.show()

print("=" * 50)
print("7. 接続性とパス分析")
print("=" * 50)
if nx.is_strongly_connected(G):
    print("ネットワークは強連結です。")
    print("平均最短経路長 (全グラフ):", nx.average_shortest_path_length(G))
    print("ネットワーク直径 (全グラフ):", nx.diameter(G))
else:
    largest_scc = max(nx.strongly_connected_components(G), key=len)
    subgraph = G.subgraph(largest_scc)
    if len(largest_scc) > 1:
        scc_path_length = nx.average_shortest_path_length(subgraph)
        scc_diameter = nx.diameter(subgraph)
        print("最大強連結成分の平均最短経路長:", scc_path_length)
        print("最大強連結成分のネットワーク直径:", scc_diameter)
    else:
        print("最大強連結成分は1ノードのみで平均最短経路長とネットワーク直径は定義されません。")

print("=" * 50)
print("8. モチーフ分析")
print("=" * 50)
motifs = nx.triadic_census(G)
num_motifs = sum(motifs.values())
print("モチーフの数:", num_motifs)
print("判定結果: グラフは" + ("モチーフを多く含む" if num_motifs > 100 else "モチーフをあまり含まない"))

print("=" * 50)
print("9. フラクタル次元の計算")
print("=" * 50)
try:
    scales = np.logspace(-2, 2, 10)
    fd = fractal_dimension(G, scales)
    print("フラクタル次元:", fd)
    print("判定結果: グラフは" + ("フラクタル的な構造を持つ" if fd > 1.5 else "ランダムに近い"))

    # フラクタル次元の可視化
    Ns = []
    for scale in scales:
        pos = nx.spring_layout(G)
        coords = np.array(list(pos.values()))
        x_min, y_min = coords.min(axis=0)
        x_max, y_max = coords.max(axis=0)
        x_bins = np.arange(x_min, x_max, scale)
        y_bins = np.arange(y_min, y_max, scale)
        hist, _, _ = np.histogram2d(coords[:, 0], coords[:, 1], bins=(x_bins, y_bins))
        Ns.append(np.sum(hist > 0))

    plt.loglog(scales, Ns, 'o-')
    plt.xlabel('Scale')
    plt.ylabel('Number of boxes')
    plt.title('Fractal Dimension (Box Counting)')
    plt.show()
except Exception as e:
    print(f"フラクタル次元の計算中にエラーが発生しました: {str(e)}")


# 10.自己参照ループの検出
self_loops = nx.number_of_selfloops(G)
nodes_with_self_loops = [n for n in G.nodes() if G.has_edge(n, n)]
self_loop_ratio = len(nodes_with_self_loops) / G.number_of_nodes()

# 自己参照ループを持つノードの特性分析
in_degrees_self_loops = [G.in_degree(n) for n in nodes_with_self_loops]
out_degrees_self_loops = [G.out_degree(n) for n in nodes_with_self_loops]
betweenness_self_loops = [betweenness_centrality[n] for n in nodes_with_self_loops]
closeness_self_loops = [closeness_centrality[n] for n in nodes_with_self_loops]
eigenvector_self_loops = [eigenvector_centrality[n] for n in nodes_with_self_loops]

print("=" * 50)
print("10. 自己参照ループの分析")
print("=" * 50)
print("自己参照ループの数:", self_loops)
print("自己参照ループを持つノードの割合: {:.2f}".format(self_loop_ratio))
print("判定結果: グラフは" + ("自己参照ループを含む" if self_loops > 0 else "自己参照ループを含まない"))

if self_loops > 0:
    print("自己参照ループを持つノードの平均入次数: {:.2f}".format(np.mean(in_degrees_self_loops)))
    print("判定結果: 自己参照ループを持つノードの入次数は" + ("高い" if np.mean(in_degrees_self_loops) > np.mean(in_degrees) else "低い"))

    print("自己参照ループを持つノードの平均出次数: {:.2f}".format(np.mean(out_degrees_self_loops)))
    print("判定結果: 自己参照ループを持つノードの出次数は" + ("高い" if np.mean(out_degrees_self_loops) > np.mean(out_degrees) else "低い"))

    print("自己参照ループを持つノードの平均媒介中心性: {:.2f}".format(np.mean(betweenness_self_loops)))
    print("判定結果: 自己参照ループを持つノードの媒介中心性は" + ("高い" if np.mean(betweenness_self_loops) > np.mean(list(betweenness_centrality.values())) else "低い"))

    print("自己参照ループを持つノードの平均近接中心性: {:.2f}".format(np.mean(closeness_self_loops)))
    print("判定結果: 自己参照ループを持つノードの近接中心性は" + ("高い" if np.mean(closeness_self_loops) > np.mean(list(closeness_centrality.values())) else "低い"))

    print("自己参照ループを持つノードの平均固有ベクトル中心性: {:.2f}".format(np.mean(eigenvector_self_loops)))
    print("判定結果: 自己参照ループを持つノードの固有ベクトル中心性は" + ("高い" if np.mean(eigenvector_self_loops) > np.mean(list(eigenvector_centrality.values())) else "低い"))
else:
    print("グラフに自己参照ループが存在しないため、自己参照ループを持つノードの特性分析はスキップします。")


print("=" * 50)
print("12. ベッチ数の算出")
print("=" * 50)

# グラフの座標を取得し、リップス複体を生成
positions = nx.get_node_attributes(G, 'pos')
points = np.array(list(positions.values()))
rips_complex = RipsComplex(points=points, max_edge_length=0.4)
simplex_tree = rips_complex.create_simplex_tree(max_dimension=2)

# 永続性の計算
simplex_tree.compute_persistence()  # この行を追加
betti_numbers = simplex_tree.betti_numbers()

print("ベッチ数:", betti_numbers)
print("判定結果: グラフは" + ("高次元の穴を含む" if len(betti_numbers) > 1 else "高次元の穴を含まない"))

print("=" * 50)
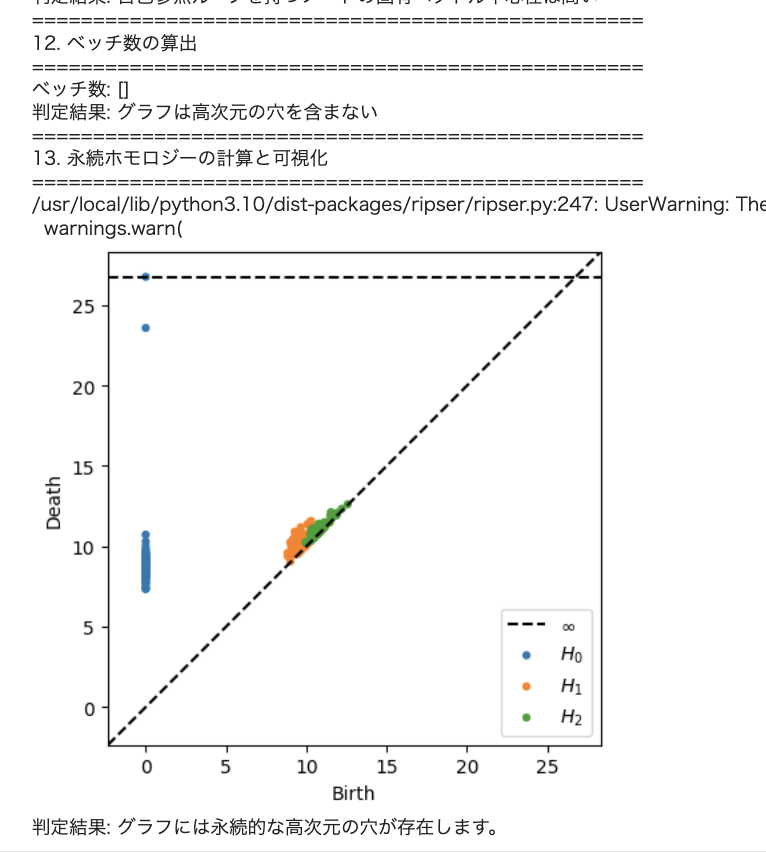
print("13. 永続ホモロジーの計算と可視化")
print("=" * 50)

# グラフの距離行列を計算
dist_matrix = nx.floyd_warshall_numpy(G)

# 無限大の値を最大の有限値に置き換える
finite_dist_matrix = np.where(np.isinf(dist_matrix), np.nanmax(dist_matrix[np.isfinite(dist_matrix)]) * 1.01, dist_matrix)

# 永続ホモロジーの計算
diagrams = ripser(finite_dist_matrix, maxdim=2)['dgms']

# 永続図の可視化
plot_diagrams(diagrams, show=True)

# 永続ホモロジーに基づいた判定結果の出力
significant_features = [dgm for dgm in diagrams[1] if dgm[1] - dgm[0] > 0.1]  # 0次元以外の、存続期間が0.1以上の特徴
if significant_features:
    print("判定結果: グラフには永続的な高次元の穴が存在します。")
else:
    print("判定結果: グラフに永続的な高次元の穴は存在しません。")


