holoviewsで細かい図の調整をするための個人用メモ
holoviews version = 0.12.15
bokeh version = 1.10.7
Curveの場合
以下を利用するとoptions一覧を取得することができる
import holoviews as hv
hv.extension('bokeh')
hv.help(hv.Curve)
実行結果(click)
Curve

Online example: http://holoviews.org/reference/elements/bokeh/Curve.html

-------------
Style Options
-------------

	alpha, color, hover_alpha, hover_color, hover_line_alpha, hover_line_color, line_alpha, line_cap, line_color, line_dash, line_join, line_width, muted_alpha, muted_color, muted_line_alpha, muted_line_color, nonselection_alpha, nonselection_color, nonselection_line_alpha, nonselection_line_color, selection_alpha, selection_color, selection_line_alpha, selection_line_color

(Consult bokeh's documentation for more information.)

------------
Plot Options
------------

The plot options are the parameters of the plotting class:

Parameters of 'CurvePlot'
=========================

Parameters changed from their default values are marked in red.
Soft bound values are marked in cyan.
C/V= Constant/Variable, RO/RW = ReadOnly/ReadWrite, AN=Allow None

Name                                 Value                         Type         Bounds     Mode

apply_extents                         True                       Boolean        (0, 1)     V RW
apply_ranges                          True                       Boolean        (0, 1)     V RW
bgcolor                               None                    ClassSelector              V RW AN
border                                 10                         Number                   V RW
default_tools       ['save', 'pan', 'wheel_zoom', 'box_zo...       List       (0, None)    V RW
finalize_hooks                         []                        HookList     (0, None)    V RW
fontsize                       {'title': '12pt'}                Parameter                V RW AN
gridstyle                              {}                          Dict                    V RW
height                                300                        Integer                   V RW
interpolation                       'linear'                  ObjectSelector               V RW
invert_axes                          False                       Boolean        (0, 1)     V RW
invert_xaxis                         False                       Boolean        (0, 1)     V RW
invert_yaxis                         False                       Boolean        (0, 1)     V RW
labelled                           ['x', 'y']                      List       (0, None)    V RW
lod                 {'factor': 10, 'interval': 300, 'thre...       Dict                    V RW
logx                                 False                       Boolean        (0, 1)     V RW
logy                                 False                       Boolean        (0, 1)     V RW
normalize                             True                       Boolean        (0, 1)     V RW
projection                            None                      Parameter                V RW AN
shared_axes                           True                       Boolean        (0, 1)     V RW
shared_datasource                     True                       Boolean        (0, 1)     V RW
show_frame                            True                       Boolean        (0, 1)     V RW
show_grid                            False                       Boolean        (0, 1)     V RW
show_legend                           True                       Boolean        (0, 1)     V RW
show_title                            True                       Boolean        (0, 1)     V RW
sizing_mode                         'fixed'                   ObjectSelector               V RW
title_format             '{label} {group} {dimensions}'           String                   V RW
toolbar                             'right'                   ObjectSelector               V RW
tools                                  []                          List       (0, None)    V RW
width                                 300                        Integer                   V RW
xaxis                               'bottom'                  ObjectSelector               V RW
xrotation                             None                       Integer       (0, 360)  V RW AN
xticks                                None                      Parameter                V RW AN
yaxis                                'left'                   ObjectSelector               V RW
yrotation                             None                       Integer       (0, 360)  V RW AN
yticks                                None                      Parameter                V RW AN

Parameter docstrings:
=====================

apply_extents:     Whether to apply extent overrides on the Elements
apply_ranges:      Whether to compute the plot bounds from the data itself.
bgcolor:           If set bgcolor overrides the background color of the axis.
border:            Minimum border around plot.
default_tools:     A list of plugin tools to use on the plot.
finalize_hooks:    Optional list of hooks called when finalizing an axis.
                   The hook is passed the plot object and the displayed
                   object, other plotting handles can be accessed via plot.handles.
fontsize:          Specifies various fontsizes of the displayed text.

                   Finer control is available by supplying a dictionary where any
                   unmentioned keys reverts to the default sizes, e.g:

                      {'ticks': '20pt', 'title': '15pt', 'ylabel': '5px', 'xlabel': '5px'}
gridstyle:         Allows customizing the grid style, e.g. grid_line_color defines
                   the line color for both grids while xgrid_line_color exclusively
                   customizes the x-axis grid lines.
height:            Height of the plot in pixels
interpolation:     Defines how the samples of the Curve are interpolated,
                   default is 'linear', other options include 'steps-mid',
                   'steps-pre' and 'steps-post'.
invert_axes:       Whether to invert the x- and y-axis
invert_xaxis:      Whether to invert the plot x-axis.
invert_yaxis:      Whether to invert the plot y-axis.
labelled:          Whether to plot the 'x' and 'y' labels.
lod:               Bokeh plots offer "Level of Detail" (LOD) capability to
                   accommodate large (but not huge) amounts of data. The available
                   options are:

                     * factor    - Decimation factor to use when applying
                                   decimation.
                     * interval  - Interval (in ms) downsampling will be enabled
                                   after an interactive event.
                     * threshold - Number of samples before downsampling is enabled.
                     * timeout   - Timeout (in ms) for checking whether interactive
                                   tool events are still occurring.
logx:              Whether the x-axis of the plot will be a log axis.
logy:              Whether the y-axis of the plot will be a log axis.
normalize:         Whether to compute ranges across all Elements at this level
                   of plotting. Allows selecting normalization at different levels
                   for nested data containers.
projection:        Allows supplying a custom projection to transform the axis
                   coordinates during display. Example projections include '3d'
                   and 'polar' projections supported by some backends. Depending
                   on the backend custom projection objects may be supplied.
shared_axes:       Whether to invert the share axes across plots
                   for linked panning and zooming.
shared_datasource: Whether Elements drawing the data from the same object should
                   share their Bokeh data source allowing for linked brushing
                   and other linked behaviors.
show_frame:        Whether or not to show a complete frame around the plot.
show_grid:         Whether to show a Cartesian grid on the plot.
show_legend:       Whether to show legend for the plot.
show_title:        Whether to display the plot title.
sizing_mode:       How the item being displayed should size itself.

                   "stretch_both" plots will resize to occupy all available
                   space, even if this changes the aspect ratio of the element.

                   "fixed" plots are not responsive and will retain their
                   original width and height regardless of any subsequent browser
                   window resize events.

                   "scale_width" elements will responsively resize to fit to the
                   width available, while maintaining the original aspect ratio.

                   "scale_height" elements will responsively resize to fit to the
                   height available, while maintaining the original aspect ratio.

                   "scale_both" elements will responsively resize to for both the
                   width and height available, while maintaining the original
                   aspect ratio.
title_format:      The formatting string for the title of this plot, allows defining
                   a label group separator and dimension labels.
toolbar:           The toolbar location, must be one of 'above', 'below',
                   'left', 'right', None.
tools:             A list of plugin tools to use on the plot.
width:             Width of the plot in pixels
xaxis:             Whether and where to display the xaxis, bare options allow suppressing
                   all axis labels including ticks and xlabel. Valid options are 'top',
                   'bottom', 'bare', 'top-bare' and 'bottom-bare'.
xrotation:         Rotation angle of the xticks.
xticks:            Ticks along x-axis specified as an integer, explicit list of
                   tick locations or bokeh Ticker object. If set to None default
                   bokeh ticking behavior is applied.
yaxis:             Whether and where to display the yaxis, bare options allow suppressing
                   all axis labels including ticks and ylabel. Valid options are 'left',
                   'right', 'bare' 'left-bare' and 'right-bare'.
yrotation:         Rotation angle of the yticks.
yticks:            Ticks along y-axis specified as an integer, explicit list of
                   tick locations or bokeh Ticker object. If set to None
                   default bokeh ticking behavior is applied.
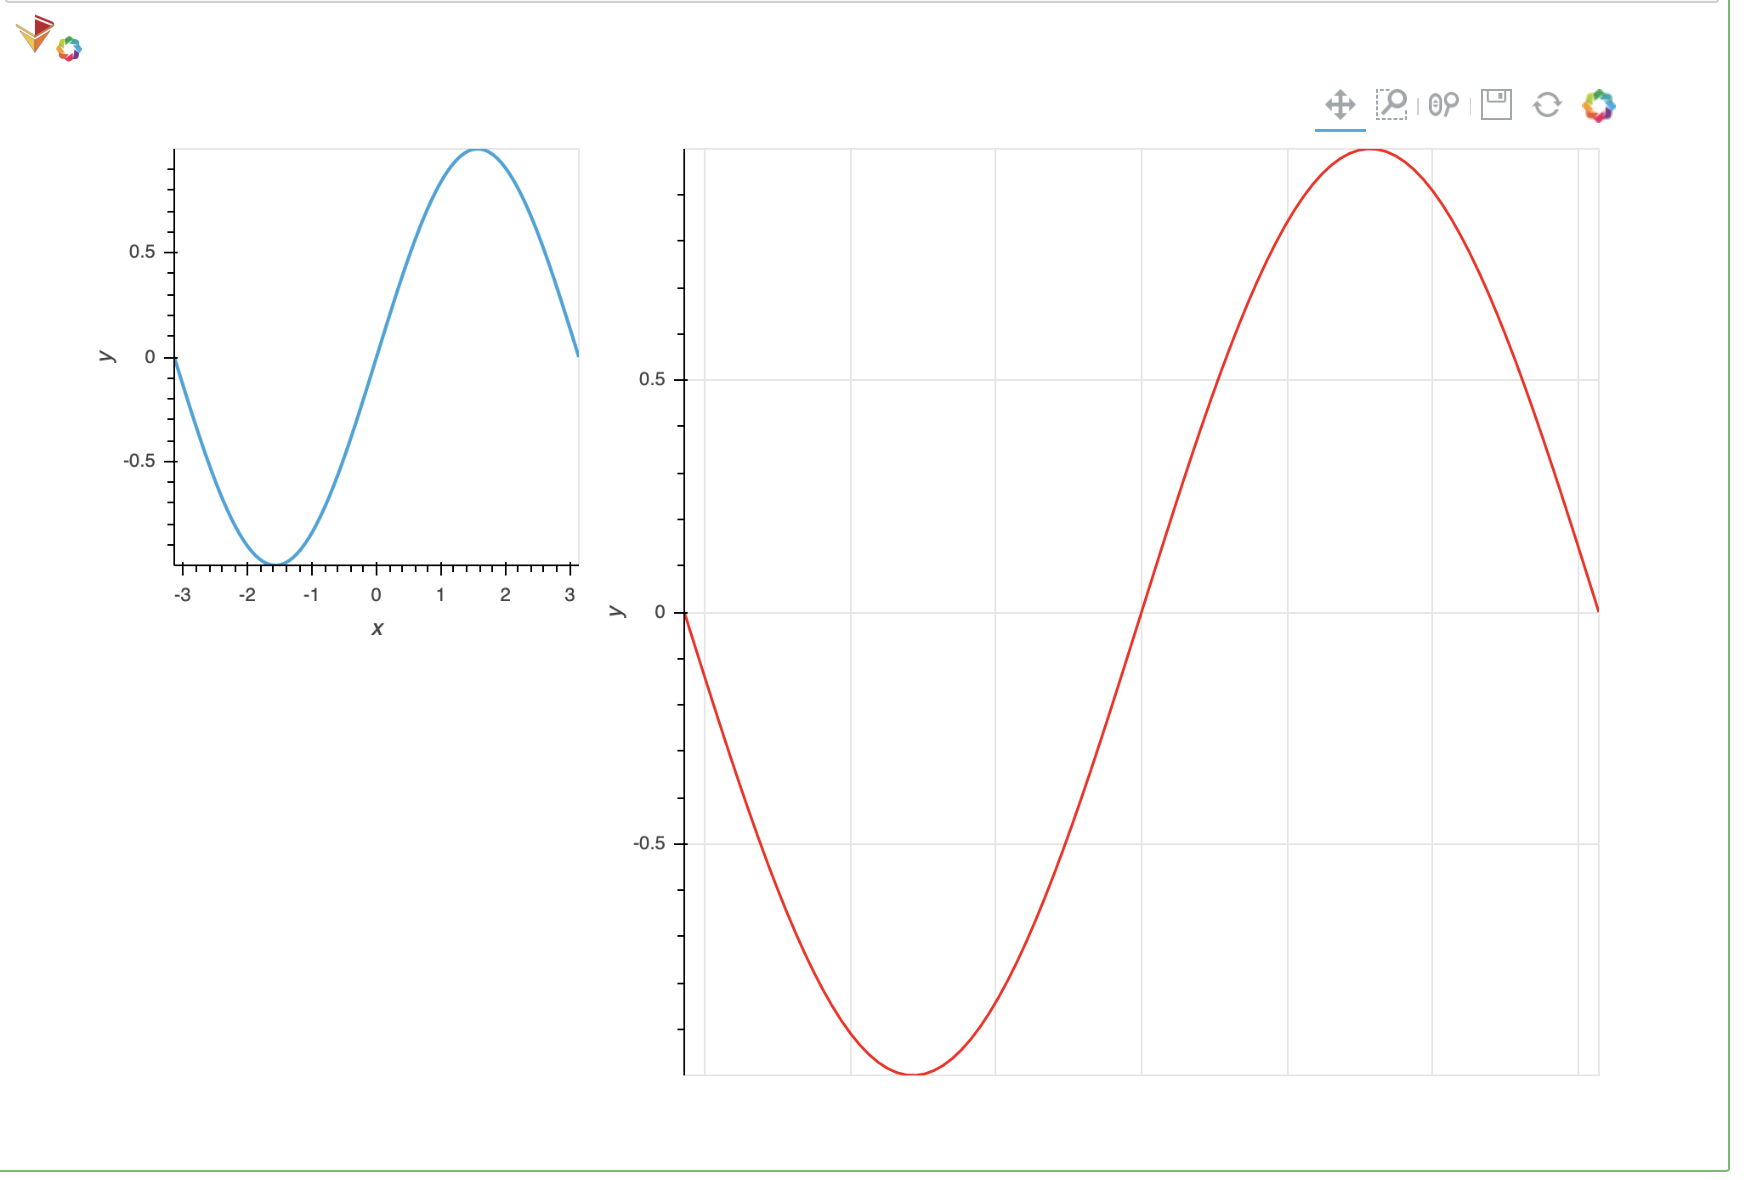
サンプルコード
.options()にdictを渡すことで細かい設定を実現する
import numpy as np
import holoviews as hv
hv.extension('bokeh')


options_dict = {
    'Curve':
    {
        'height':600,
        'width':600,
        'color':'red',
        'line_width': 1.5,
        'xaxis':None, # None, top, bottom, bare, top-bare, bottom-bare, None が選択できる
        'yaxis':'left', #'left' left, right, bare, left-bare, right-bare, None が選択できる
        'normalize': True,
        'show_grid':True,
        'shared_axes':True,
        'xlabel': 'x', # 今回は非表示にしている
        'ylabel': 'y',
    },
}


x = np.linspace(-np.pi, np.pi, 100)
y = np.sin(x)
hv.Curve((x, y)) + hv.Curve((x, y)).options(options_dict)
Pointsの場合
import holoviews as hv
hv.extension('bokeh')
 hv.help(hv.Points)
実行結果(click)
Points

Online example: http://holoviews.org/reference/elements/bokeh/Points.html

-------------
Style Options
-------------

	alpha, cmap, color, fill_alpha, fill_color, hover_alpha, hover_color, hover_fill_alpha, hover_fill_color, hover_line_alpha, hover_line_color, line_alpha, line_cap, line_color, line_dash, line_join, line_width, marker, muted_alpha, muted_color, muted_fill_alpha, muted_fill_color, muted_line_alpha, muted_line_color, nonselection_alpha, nonselection_color, nonselection_fill_alpha, nonselection_fill_color, nonselection_line_alpha, nonselection_line_color, palette, selection_alpha, selection_color, selection_fill_alpha, selection_fill_color, selection_line_alpha, selection_line_color, size

(Consult bokeh's documentation for more information.)

------------
Plot Options
------------

The plot options are the parameters of the plotting class:

Parameters of 'PointPlot'
=========================

Parameters changed from their default values are marked in red.
Soft bound values are marked in cyan.
C/V= Constant/Variable, RO/RW = ReadOnly/ReadWrite, AN=Allow None

Name                                 Value                         Type         Bounds     Mode

apply_extents                         True                       Boolean        (0, 1)     V RW
apply_ranges                          True                       Boolean        (0, 1)     V RW
bgcolor                               None                    ClassSelector              V RW AN
border                                 10                         Number                   V RW
clipping_colors                        {}                          Dict                    V RW
color_index                           None                    ClassSelector              V RW AN
color_levels                          None                    ClassSelector              V RW AN
colorbar                             False                       Boolean        (0, 1)     V RW
colorbar_opts                          {}                          Dict                    V RW
colorbar_position                   'right'                   ObjectSelector               V RW
default_tools       ['save', 'pan', 'wheel_zoom', 'box_zo...       List       (0, None)    V RW
finalize_hooks                         []                        HookList     (0, None)    V RW
fontsize                       {'title': '12pt'}                Parameter                V RW AN
gridstyle                              {}                          Dict                    V RW
height                                300                        Integer                   V RW
invert_axes                          False                       Boolean        (0, 1)     V RW
invert_xaxis                         False                       Boolean        (0, 1)     V RW
invert_yaxis                         False                       Boolean        (0, 1)     V RW
jitter                                None                        Number      (0, None)  V RW AN
labelled                           ['x', 'y']                      List       (0, None)    V RW
legend_cols                          False                       Integer                   V RW
legend_muted                         False                       Boolean        (0, 1)     V RW
legend_offset                        (0, 0)                    NumericTuple                V RW
legend_position                   'top_right'                 ObjectSelector               V RW
lod                 {'factor': 10, 'interval': 300, 'thre...       Dict                    V RW
logx                                 False                       Boolean        (0, 1)     V RW
logy                                 False                       Boolean        (0, 1)     V RW
logz                                 False                       Boolean        (0, 1)     V RW
normalize                             True                       Boolean        (0, 1)     V RW
projection                            None                      Parameter                V RW AN
scaling_factor                         1                          Number      (0, None)    V RW
scaling_method                       'area'                   ObjectSelector               V RW
shared_axes                           True                       Boolean        (0, 1)     V RW
shared_datasource                     True                       Boolean        (0, 1)     V RW
show_frame                            True                       Boolean        (0, 1)     V RW
show_grid                            False                       Boolean        (0, 1)     V RW
show_legend                           True                       Boolean        (0, 1)     V RW
show_title                            True                       Boolean        (0, 1)     V RW
size_fn                        <ufunc 'absolute'>                Callable                  V RW
size_index                            None                    ClassSelector              V RW AN
sizing_mode                         'fixed'                   ObjectSelector               V RW
symmetric                            False                       Boolean        (0, 1)     V RW
title_format             '{label} {group} {dimensions}'           String                   V RW
toolbar                             'right'                   ObjectSelector               V RW
tools                                  []                          List       (0, None)    V RW
width                                 300                        Integer                   V RW
xaxis                               'bottom'                  ObjectSelector               V RW
xrotation                             None                       Integer       (0, 360)  V RW AN
xticks                                None                      Parameter                V RW AN
yaxis                                'left'                   ObjectSelector               V RW
yrotation                             None                       Integer       (0, 360)  V RW AN
yticks                                None                      Parameter                V RW AN

Parameter docstrings:
=====================

apply_extents:     Whether to apply extent overrides on the Elements
apply_ranges:      Whether to compute the plot bounds from the data itself.
bgcolor:           If set bgcolor overrides the background color of the axis.
border:            Minimum border around plot.
clipping_colors:   Dictionary to specify colors for clipped values, allows
                   setting color for NaN values and for values above and below
                   the min and max value. The min, max or NaN color may specify
                   an RGB(A) color as a color hex string of the form #FFFFFF or
                   #FFFFFFFF or a length 3 or length 4 tuple specifying values in
                   the range 0-1 or a named HTML color.
color_index:       Index of the dimension from which the color will the drawn
color_levels:      Number of discrete colors to use when colormapping or a set of color
                   intervals defining the range of values to map each color to.
colorbar:          Whether to display a colorbar.
colorbar_opts:     Allows setting specific styling options for the colorbar overriding
                   the options defined in the colorbar_specs class attribute. Includes
                   location, orientation, height, width, scale_alpha, title, title_props,
                   margin, padding, background_fill_color and more.
colorbar_position: Allows selecting between a number of predefined colorbar position
                   options. The predefined options may be customized in the
                   colorbar_specs class attribute.
default_tools:     A list of plugin tools to use on the plot.
finalize_hooks:    Optional list of hooks called when finalizing an axis.
                   The hook is passed the plot object and the displayed
                   object, other plotting handles can be accessed via plot.handles.
fontsize:          Specifies various fontsizes of the displayed text.

                   Finer control is available by supplying a dictionary where any
                   unmentioned keys reverts to the default sizes, e.g:

                      {'ticks': '20pt', 'title': '15pt', 'ylabel': '5px', 'xlabel': '5px'}
gridstyle:         Allows customizing the grid style, e.g. grid_line_color defines
                   the line color for both grids while xgrid_line_color exclusively
                   customizes the x-axis grid lines.
height:            Height of the plot in pixels
invert_axes:       Whether to invert the x- and y-axis
invert_xaxis:      Whether to invert the plot x-axis.
invert_yaxis:      Whether to invert the plot y-axis.
jitter:            The amount of jitter to apply to offset the points along the x-axis.
labelled:          Whether to plot the 'x' and 'y' labels.
legend_cols:       Whether to lay out the legend as columns.
legend_muted:      Controls whether the legend entries are muted by default.
legend_offset:     If legend is placed outside the axis, this determines the
                   (width, height) offset in pixels from the original position.
legend_position:   Allows selecting between a number of predefined legend position
                   options. The predefined options may be customized in the
                   legend_specs class attribute.
lod:               Bokeh plots offer "Level of Detail" (LOD) capability to
                   accommodate large (but not huge) amounts of data. The available
                   options are:

                     * factor    - Decimation factor to use when applying
                                   decimation.
                     * interval  - Interval (in ms) downsampling will be enabled
                                   after an interactive event.
                     * threshold - Number of samples before downsampling is enabled.
                     * timeout   - Timeout (in ms) for checking whether interactive
                                   tool events are still occurring.
logx:              Whether the x-axis of the plot will be a log axis.
logy:              Whether the y-axis of the plot will be a log axis.
logz:              Whether to apply log scaling to the z-axis.
normalize:         Whether to compute ranges across all Elements at this level
                   of plotting. Allows selecting normalization at different levels
                   for nested data containers.
projection:        Allows supplying a custom projection to transform the axis
                   coordinates during display. Example projections include '3d'
                   and 'polar' projections supported by some backends. Depending
                   on the backend custom projection objects may be supplied.
scaling_factor:    Scaling factor which is applied to either the width or area
                   of each point, depending on the value of `scaling_method`.
scaling_method:    Determines whether the `scaling_factor` should be applied to
                   the width or area of each point (default: "area").
shared_axes:       Whether to invert the share axes across plots
                   for linked panning and zooming.
shared_datasource: Whether Elements drawing the data from the same object should
                   share their Bokeh data source allowing for linked brushing
                   and other linked behaviors.
show_frame:        Whether or not to show a complete frame around the plot.
show_grid:         Whether to show a Cartesian grid on the plot.
show_legend:       Whether to show legend for the plot.
show_title:        Whether to display the plot title.
size_fn:           Function applied to size values before applying scaling,
                   to remove values lower than zero.
size_index:        Index of the dimension from which the sizes will the drawn.
sizing_mode:       How the item being displayed should size itself.

                   "stretch_both" plots will resize to occupy all available
                   space, even if this changes the aspect ratio of the element.

                   "fixed" plots are not responsive and will retain their
                   original width and height regardless of any subsequent browser
                   window resize events.

                   "scale_width" elements will responsively resize to fit to the
                   width available, while maintaining the original aspect ratio.

                   "scale_height" elements will responsively resize to fit to the
                   height available, while maintaining the original aspect ratio.

                   "scale_both" elements will responsively resize to for both the
                   width and height available, while maintaining the original
                   aspect ratio.
symmetric:         Whether to make the colormap symmetric around zero.
title_format:      The formatting string for the title of this plot, allows defining
                   a label group separator and dimension labels.
toolbar:           The toolbar location, must be one of 'above', 'below',
                   'left', 'right', None.
tools:             A list of plugin tools to use on the plot.
width:             Width of the plot in pixels
xaxis:             Whether and where to display the xaxis, bare options allow suppressing
                   all axis labels including ticks and xlabel. Valid options are 'top',
                   'bottom', 'bare', 'top-bare' and 'bottom-bare'.
xrotation:         Rotation angle of the xticks.
xticks:            Ticks along x-axis specified as an integer, explicit list of
                   tick locations or bokeh Ticker object. If set to None default
                   bokeh ticking behavior is applied.
yaxis:             Whether and where to display the yaxis, bare options allow suppressing
                   all axis labels including ticks and ylabel. Valid options are 'left',
                   'right', 'bare' 'left-bare' and 'right-bare'.
yrotation:         Rotation angle of the yticks.
yticks:            Ticks along y-axis specified as an integer, explicit list of
                   tick locations or bokeh Ticker object. If set to None
                   default bokeh ticking behavior is applied.
Plot rangeとTitleをoptionsの中でいじる方法がわからなかった
しばらくはこっちを使う
https://qiita.com/ymd_/items/67d5977987c7b547cd7b
Barsの順番を変える
.redim.values(Param=['a','b','c'])
ここでParamはdataframeの列名
よく使うオプション
plot_obj.opts(width=800, legend_position='right')
defaultで便利な設定
- サイズを横長
- マウスオーバーで値を表示
- 凡例を枠の外の右側に
import holoviews as hv
from holoviews import opts
hv.extension('bokeh')


opts.defaults(opts.Curve(tools=['hover']), opts.Overlay(width=800, legend_position='right'))