緯度経度の座標情報をkepler.glで可視化する
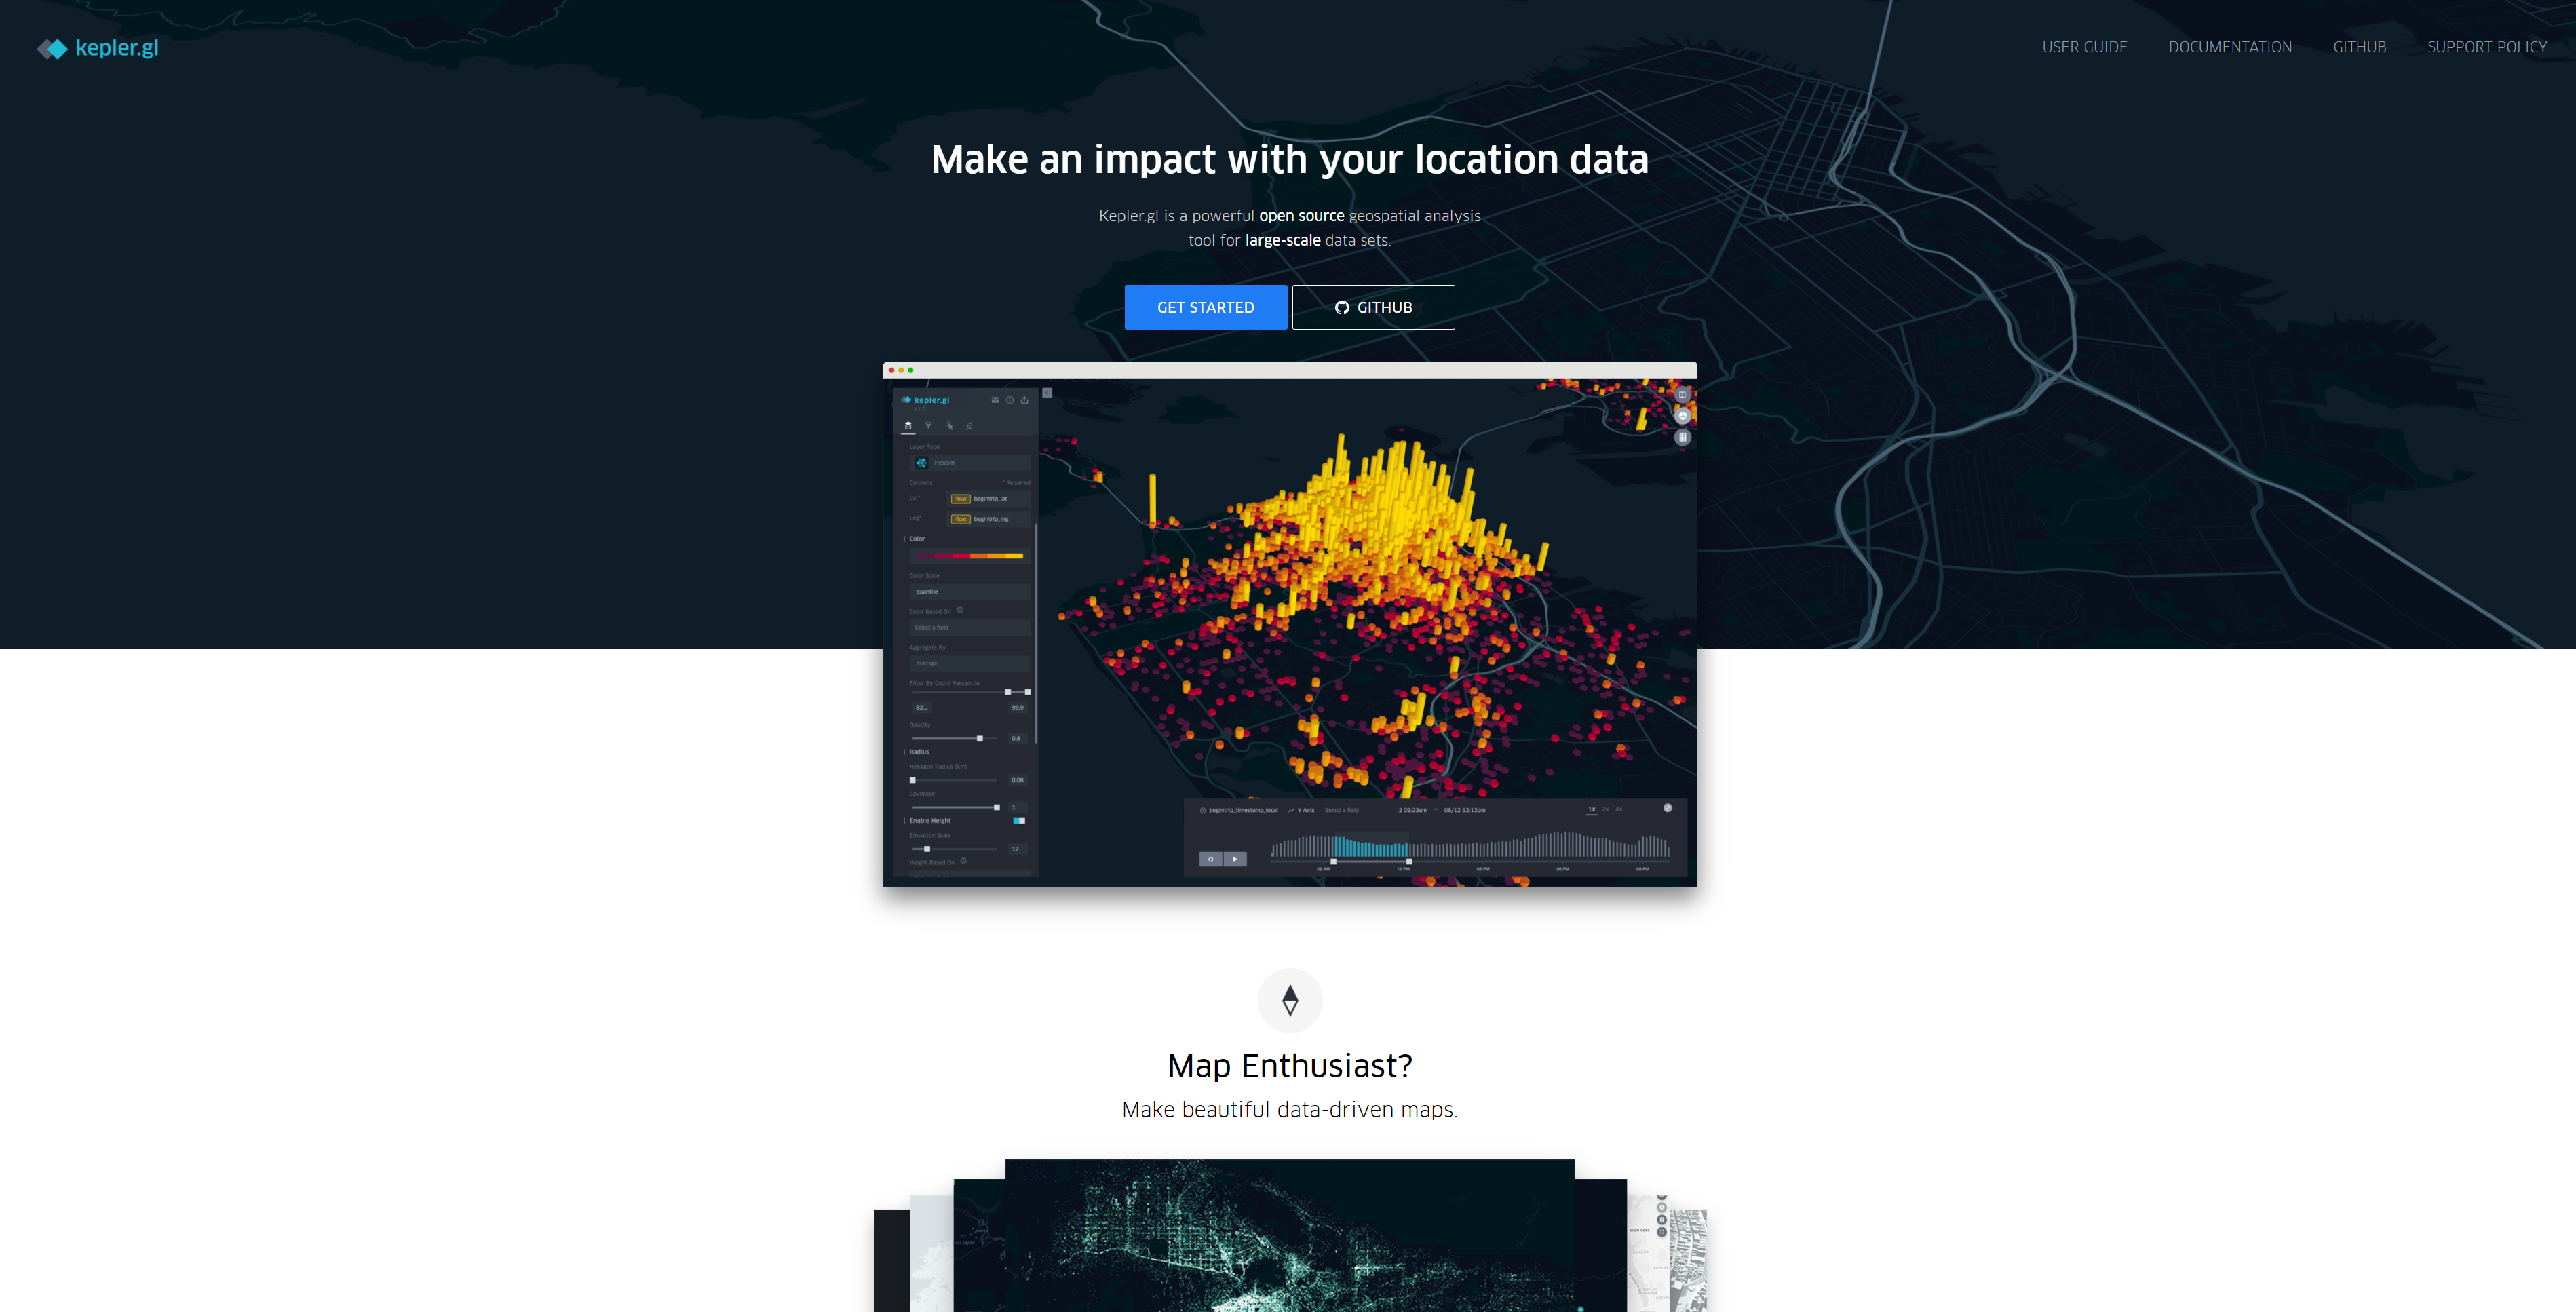
kepler.glは地図上で様々なデータを可視化することができるツールである。今回はGPSデータを動画で可視化する。
手元にあるもの
gpxデータから作成したcsvファイル。
内訳はこのようになっている。
| ID | 時刻 | 経度 | 緯度 | 速度 | trackID | segmentID | pointID |
|---|---|---|---|---|---|---|---|
| int | datetime | float | float | float | int | int | int |
このうち、IDとtrackIDで分類すればトリップを一意に特定できるっぽい仕組みになっている。
もちろん、この形式に限らず緯度,経度,(高度),時刻のデータが何らかの形でまとまっていればよい。
求められているもの
公式ドキュメントによると、
How to use trip layer to animate path
Data format Currently trip layer support a special geoJSON format where the coordinate linestring has a 4th element denoting timestamp.
In order to animate the path, the geoJSON data needs to contain LineString in its features' geometry, and the coordinates in the LineString need to have 4 elements in the format of [longitude, latitude, altitude, timestamp], with the last element being a timestamp. Valid timestamp formats include unix in seconds such as 1564184363 or in milliseconds such as 1564184363000.
ということらしい。要約すると以下が必要である。
- GeoJsonファイル
- LineString形式
- 座標形式:[経度,緯度,標高,UNIX秒]
【追記】ポイントデータは3点以上ないと動画による可視化ができないので、ODペアのみのデータを用いる際には別の手法を使ったほうが良い
ありがたいことにサンプルデータもついており、
{
  "type": "FeatureCollection",
  "features": [
    {
      "type": "Feature",
      "properties": {
        "vendor":  "A"
      },
      "geometry": {
        "type": "LineString",
        "coordinates": [
          [-74.20986, 40.81773, 0, 1564184363],
          [-74.20987, 40.81765, 0, 1564184396],
          [-74.20998, 40.81746, 0, 1564184409]
        ]
      }
    }
  ]
}
この形式が求められている。
GeoJsonについて
だいたいJsonと同じらしい。Googleのロケーション履歴をダウンロードしようとするとJson形式で提供されるし、地理情報を含むJsonファイルを区別の意味を込めてGeoJsonと呼んでいるような雰囲気を感じた。実際、同じ内容で拡張子だけ.jsonにしたファイルも同様に読み込むことができた。
改めて先ほどのサンプルデータに注目すると、
- FeatureCollection
- type
- Features
- type
- properties
- type
- vendor
- geometry
- type
- coordinates
という構造になっている。つまり、これを満たす構造にしてやれば読み込まれるということである。
DataFrameから座標リストの作成
各データの列名は以下の通り。(今回は標高データがないので速度データで代用している)
| ID | 時刻 | 経度 | 緯度 | 速度 | trackID | segmentID | pointID |
|---|---|---|---|---|---|---|---|
| "ID" | "time" | "longitude" | "latitude" | "speed" | "trackID" | "segmentID" | "pointID" |
まず、時刻をdatetime型からtimestamp型(UNIX秒)に変換する。
df["time"] = df["time"].apply(lambda x: x.timestamp())
# DataFrame
次にDataFrameから必要な項目だけを取り出す。リストで指定することで複数項目を一気に取得できる。
df_coordinate = df[["longitude","latitude","speed","time"]]
# DataFrame
次に、IDとtrackIDで分類できるようにする。
g = df_coordinate.groupby(["ID","trackID"])
# DataFrameGroupBy
次に各行(df[["longitude","latitude","speed","time"]]の一行ずつ)をリストにする。
coordinate_listにはdf_coordinateのID,trackID毎のリストのSeriesが作成される。
coordinate_list= g.apply(lambda d : d.values.tolist())
# Series ここ間違えやすい
最後にSeriesをlistに変換する。
coordinate_list = coordinate_list.values.tolist()
# list
これで、手元にリスト[経度,緯度,標高,UNIX秒]の1トリップ分のリストのリストができている。
- すべてのトリップのリスト
- 1トリップのリスト
- 1点のリスト
- 経度
- 緯度
- 標高(速度)
- 時刻
- 1点のリスト
- 1トリップのリスト
という構造である。
GeoJson形式への変換
前項で作成したリストを用いて、GeoJsonデータを作成する。これにはgeojsonというライブラリを用いた。
素人目の認識としては、json書式に整えてくれるモジュールである。
先ほども書いた通り、求められるデータは以下の形式である。これらのデータを下から組み立てるように作成していくのが着実である。
- FeatureCollection
- type(自己紹介)
- Features
- type(自己紹介)
- properties(geometoryの詳細)
- type(自己紹介)
- vendor
- geometry(地理データ)
- type(自己紹介)
- coordinates(LineString)
このモジュールは単純で、例えばFeatureを作りたければ以下のようにすればよい。
つまり、自己紹介部分や括弧などを勝手に追加してくれるというものである。
> Feature(geometry=my_point)  # doctest: +ELLIPSIS
{"geometry": {"coordinates": [-3.68..., 40.4...], "type": "Point"}, "properties": {}, "type": "Feature"}
この例文を参考に組み立てたものを以下に示す。
# Featureを蓄積するリストを作る
feature_list = list()

# FeatureリストにFeatureを蓄積させる
for i in range(len(coordinate_list)):
    #ptsに1トリップ分のリストを代入
    pts = coordinate_list[i]
    #lsにptsをGeoJson形式に変換したものを代入
    ls = geojson.LineString(pts)
    #lsをgeometryとし、propertiesと合わせてFeatureを作成
    #feature_listの末尾に追加
    feature_list.append(geojson.Feature(properties={'tripID': str(i)},geometry=ls))

# feature_listをFeatureCollectionに変換
Tripdata = geojson.FeatureCollection(feature_list)
これによってTripdataには求められる形式の平文が入ったものとなる。
ちなみにpropertiesにはFeature毎の識別情報を入れることが可能である。工夫次第では人ごとに分類、時間ごとに分類など様々な分類ができる。
書き出し
ここまで出来ればほぼ終わりである。
新たに拡張子に.geojsonをもつファイルを作成し、そこに平文を書き込むことでデータの完成となる。
path = './Tripdata.geojson'
with open(path, 'w') as f:
    f.write(geojson.dumps(Tripdata))
    f.close()
可視化
大げさに可視化と書いたが、先ほど作成したデータをドラッグ&ドロップするだけで終了である。
kepler.glを開く。

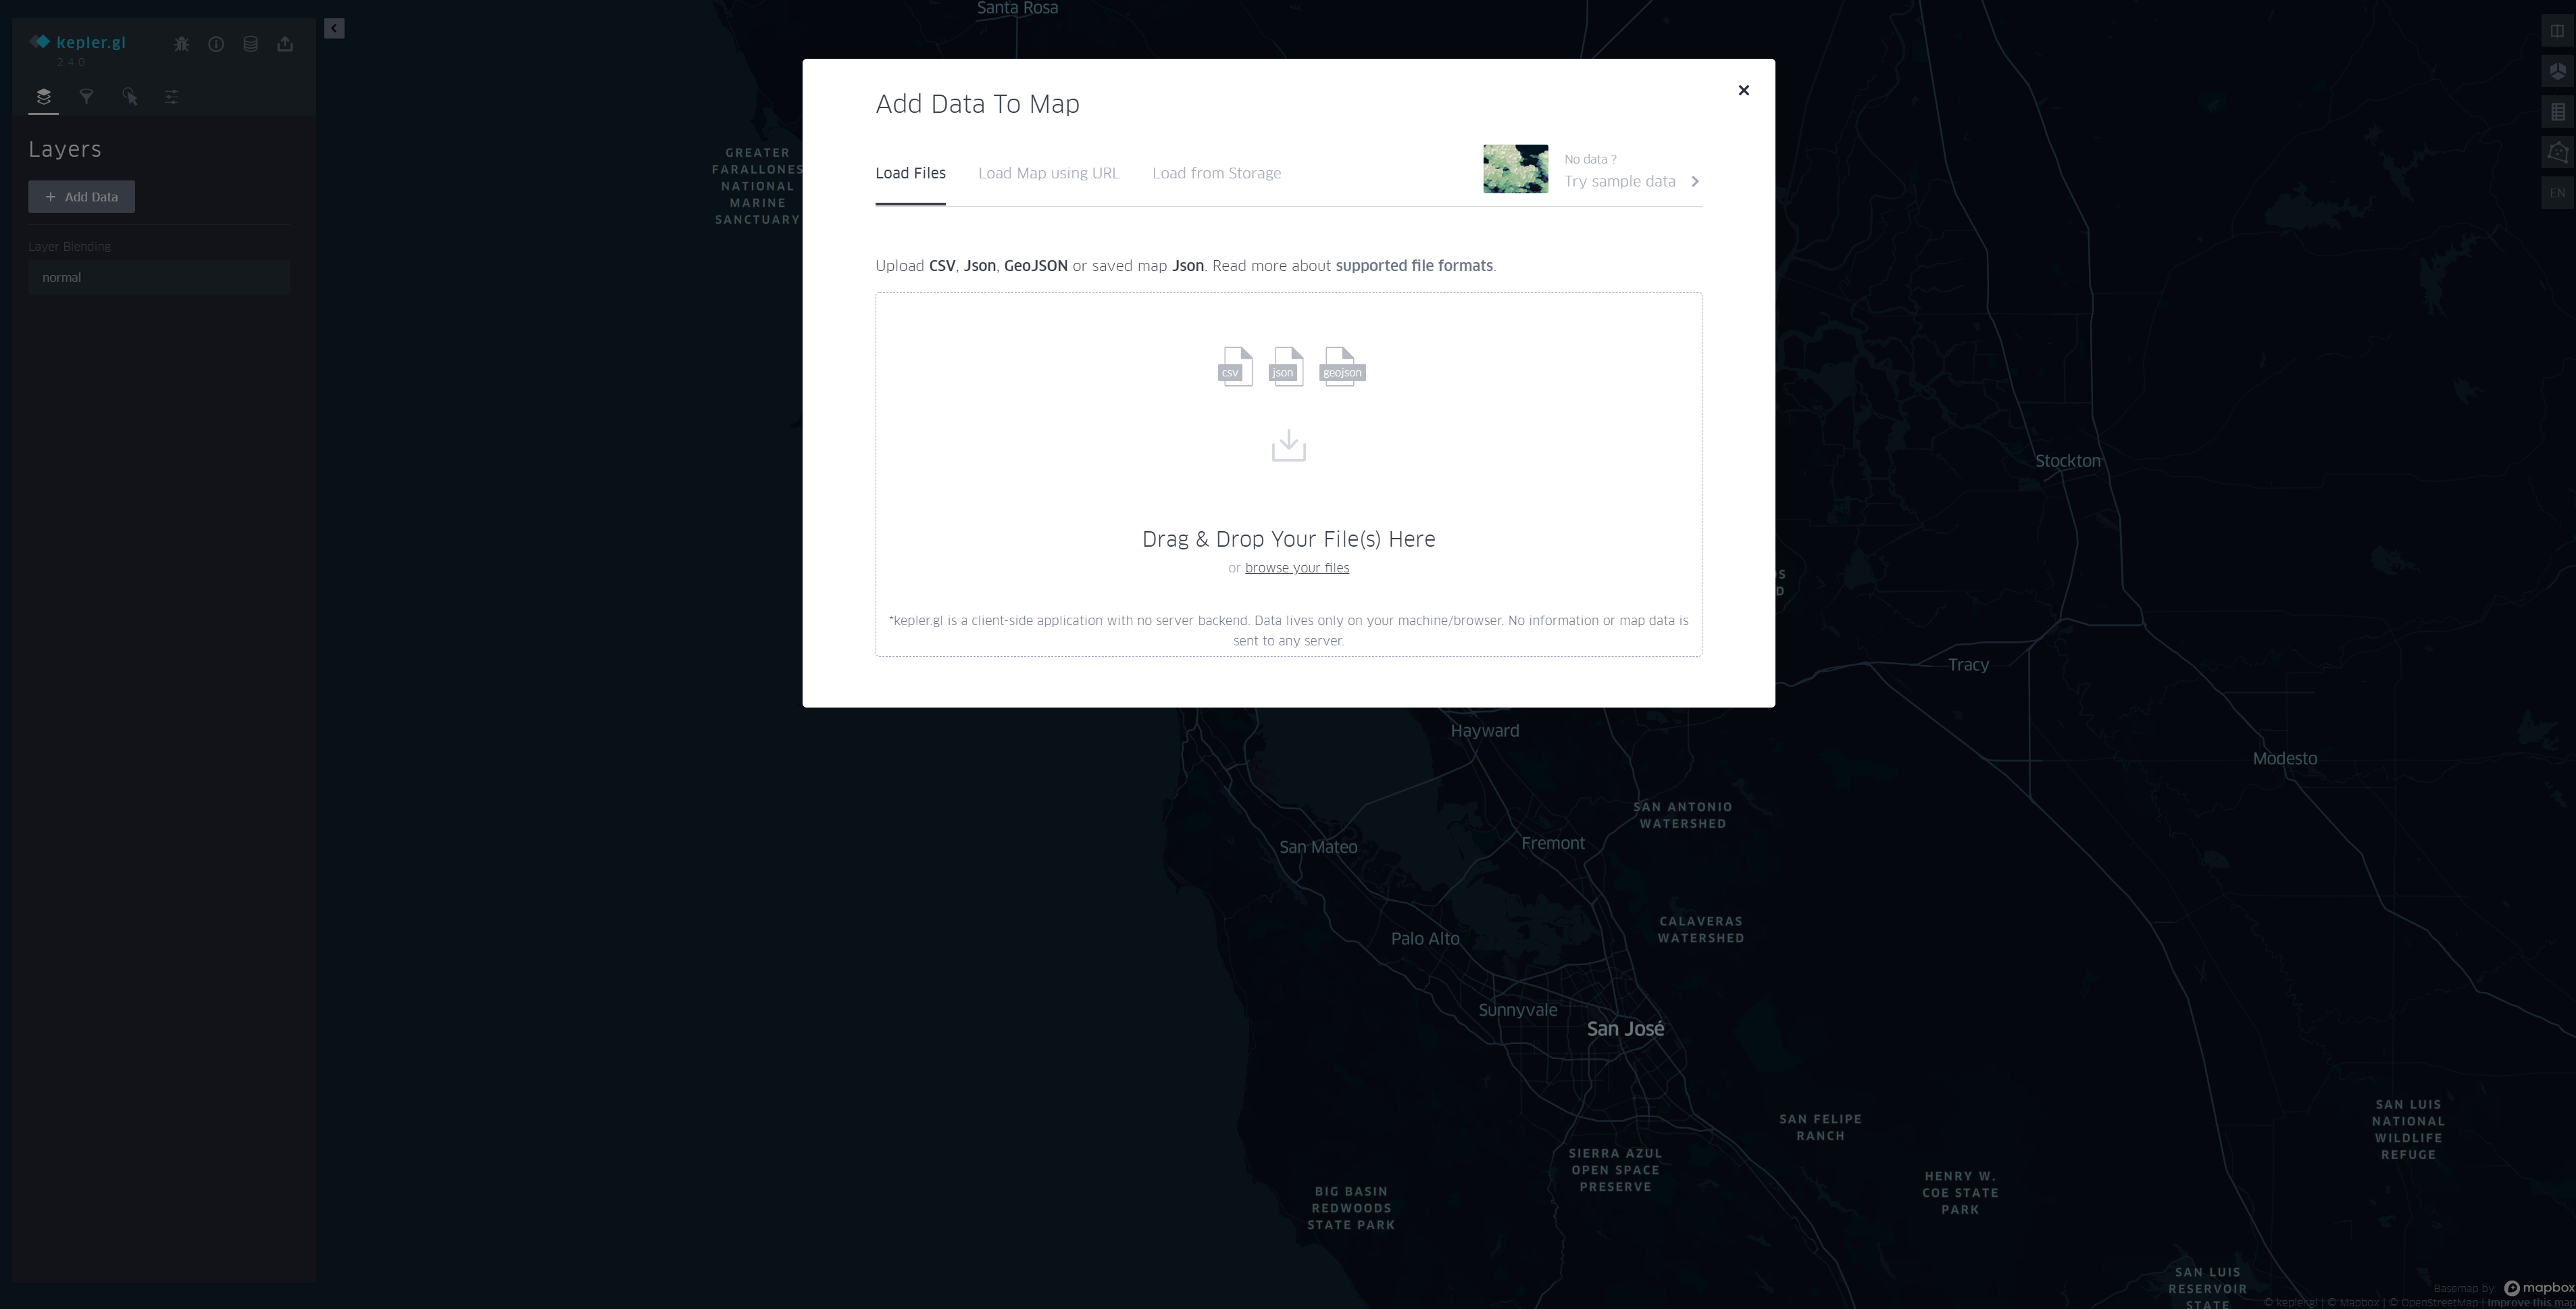
GET STRATEDをクリックすると、以下の画面に遷移する。
Drag & Drop Your File(s) Here にドラッグ&ドロップすれば自動的に動画にしてくれる。
移動する点は、色・サイズ・尾の長さが指定可能であり、レイヤを上下させることで表示する順番も指定できる。また、propertiesに属性情報を追加しておくことで、それをもとに分類することも可能である。
データはローカルで処理されるので、個人情報を入れても大丈夫(公式談)らしい。
Tipsとまとめ
すべてのデータについて、年月日だけを同じ日にしてやると時間帯のみの可視化ができるので、移動の多い時間帯が一目でわかりやすい。
変換はdatetimeのうちがやりやすいので、UNIX秒に変換する前にreplace()をするとよい。
df["time"] = df["time"].apply(lambda x: x.replace(year=2021,month=1,day=1))
df["time"] = df["time"].apply(lambda x: x.timestamp())
これら一連の流れでとても見栄えのいい可視化ができるので、ぜひ挑戦してほしい。
