前書き
何のための記事か
Stanとかやったことのないおっさんが、仕事でMCMCを使ってみたいので、一から覚えるための覚書。
勉強し始めたばかりなので間違いなどあるかも。
目次
- Pystan のインストール
- 例題に挑戦
- 参照サイト
本論
Pystan のインストール
conda 経由でインストール
pipでインストールでもよかったのですが、Anaconda Cloudでパッケージを見つけたのでなんとなくconda経由でインストール
conda install -c conda-forge pystan
例題に挑戦
[PyStan 公式サイト] (http://pystan.readthedocs.io/en/latest/index.html)にある例題を参考
データの生成
使用するデータは、8個の学校でのコーチングの効果?に関する研究に基づくものらしい。
Jが学校数、yが効果、sigmaが効果標準偏差。yを説明できるパラメータをMCMCで求める。
import pystan
schools_dat = {'J': 8, 'y': [28,  8, -3,  7, -1,  1, 18, 12],
               'sigma': [15, 10, 16, 11,  9, 11, 10, 18]}
Stanの記述
data ブロックはデータ型と変数名の定義
parameters ブロック以降がモデルにかんする記述
平均が theta, 標準偏差が sigma の正規分布を y にあてはめる
ここで、theta = mu + tau * eta で表される線形予測子
mu は無情報事前分布(を近似した分散の大きい正規分布)
tau は正の無情報事前分布
eta は標準正規分布
定数 mu と tau を求める
thetaを直接推定するのではなく、muとtauからthetaを推定するのが、なんだかStanっぽい
schools_code = """
data {
    int<lower=0> J; // number of schools
    real y[J]; // estimated treatment effects
    real<lower=0> sigma[J]; // s.e. of effect estimates
}
parameters {
    real mu;
    real<lower=0> tau;
    real eta[J];
}
transformed parameters {
    real theta[J];
    for (j in 1:J)
    theta[j] = mu + tau * eta[j];
}
model {
    eta ~ normal(0, 1);
    y ~ normal(theta, sigma);
}
"""
フィッティング
フィッティングはたったの2行
sm = pystan.StanModel(model_code=schools_code)
fit = sm.sampling(data=schools_dat, iter=1000, chains=4)
結果
fit.extractで結果を辞書型で格納
la = fit.extract(permuted=True)
print(la['mu'])

> [  2.26169685   7.16400113  12.47582276 ...,   0.91833614  15.98670397  11.11211459]

la['mu'].shape

> (2000,)
print(fit)でこんな感じの結果がでてくる
mu の平均が7.68で標準偏差が5.38、tauの平均が6.7で標準偏差が6.38てなってますね。
print(fit)

>Inference for Stan model: anon_model_cbe9cd2f1e5ab5d1c7cce1f23ca970b4.
>4 chains, each with iter=1000; warmup=500; thin=1;
>post-warmup draws per chain=500, total post-warmup draws=2000.
>           mean se_mean     sd   2.5%    25%    50%    75%  97.5%  n_eff   Rhat
>mu         7.68    0.25   5.38  -3.72   4.36   7.64  10.83  18.47    448   1.01
>tau         6.7    0.38   6.38   0.14   2.35   5.03   9.16  22.67    283   1.01
>eta[0]     0.42    0.02   0.97  -1.55  -0.21   0.46   1.05   2.26   2000    1.0
>eta[1]  -5.5e-3    0.02   0.87  -1.69  -0.56 9.7e-3   0.55    1.7   2000    1.0
>eta[2]    -0.19    0.02   0.96  -2.15  -0.81   -0.2   0.44   1.64   2000    1.0
>eta[3]    -0.01    0.02   0.85  -1.71  -0.55  -0.02   0.52    1.7   2000    1.0
>...
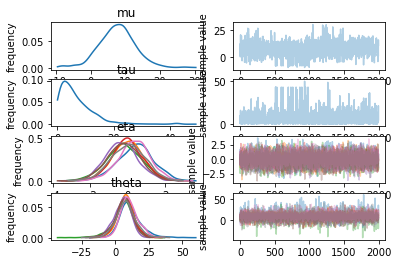
fit.plot()でグラフ出力
まずは動いたので今日はここまで。
参照サイト
今回参考にしたWebsiteなど
- PyStanでMCMC入門
- [PyStan 公式サイト] (http://pystan.readthedocs.io/en/latest/index.html)
- Anaconda Cloud
