scikit-learnのRandomForestClassifierを使うことで,分類問題をランダムフォレストで解くことが出来ます.
ランダムフォレストの特徴として,同じクラスに属するデータから,クラスを代表する属性値とは離れた値をもつ外れ値(outlier)のデータを特定することができます.
公式のscikit-learnでは外れ値を算出する機能がないため,今回はoutlierを出力するスクリプトを作成しました.
(ちなみにRでは算出が可能です)
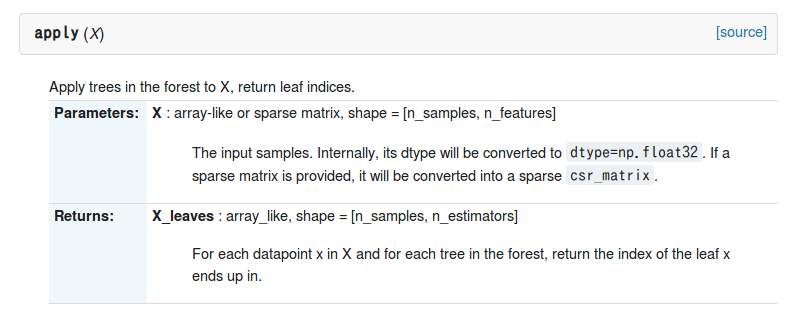
外れ値と求めるためには,scikit-learnのRandomForestClassifierのメソッドにあるapplyを使用します.
これはランダムフォレストアルゴリズムで作成した各決定木にバッチの入力データを与えた時,各データがどの葉に含まれるかを葉のインデックスで返してくるメソッドです.
コードについて
外れ値を求めるためには,はじめに各データの近似度を求める必要があります.
近似度の算出
applyメソッドが返してくる配列を引数にして,各データの近似度を求めます.
applyメソッドは[サンプル数,決定木の数]の2次元配列で返してきます.
proximityでは,データ$x_{n}$と同じ葉に含まれるデータ$x_{k}$をカウントし,それを作成した全ての決定木で行って総和を取ります.
その結果を最後に決定木の数で割り正規化することで,データ$x_{n}$の近似度を求めます.
最終的な結果を[サンプル数,サンプル数]の2次元配列で返します.
(ちなみに配列は対角行列になります)
def proximity(data):
  n_samples = np.zeros((len(data),len(data)))
  n_estimators = len(data[0])

  for e,est in enumerate(np.transpose(np.array(data))):
    for n,n_node in enumerate(est):
      for k,k_node in enumerate(est):
        if n_node == k_node:
          n_samples[n][k] += 1

  n_samples = 1.0 * np.array(n_samples) / n_estimators

  return n_samples
外れ値の算出
近似度を求めたら,次に外れ値を求めます.
同じクラス内の外れ値の算出のため,正解ラベルの配列を引数にします.
処理の流れとしては以下になります.
-
クラス内の近似度の平均値を求める
-
各データの外れ値を求める
-
各クラスの外れ値の中央値,中央絶対偏差(MAD)を求める
-
各データの外れ値を中央値,中央絶対偏差で正規化する
処理としてはこれだけで,numpyを使うことで簡単に書けます.
for文も内包表記にすれば,より高速化できます.
また,XGBoostのscikit-learnラッパーを使用することで,XGBoostを使った外れ値の特定も可能です.
ちなみに外れ値の正規化で,平均,標準偏差でなく,中央値,MADを使うのは,外れ値に対して影響されにくい統計量(ロバスト)であるためです.
def outlier(data, label):
  N = len(label)
  pbar = [0] * N
  data = np.square(data)

  # クラス内の近似度の平均値を求める
  for n,n_prox2 in enumerate(data):
    for k,k_prox2 in enumerate(n_prox2):
      if label[n] == label[k]:
        pbar[n] += k_prox2
    if pbar[n] == 0.0:
      pbar[n] = 1.0e-32

  # 外れ値を求める
  out = N / np.array(pbar)

  # 各クラスの外れ値の中央値を求める
  meds = {}
  for n,l in enumerate(label):
    if l not in meds.keys():
      meds[l] = []
    meds[l].append(out[n])

  label_uniq = list(set(label))
  med_uniq = {} # 実際の各クラスの中央値はこの変数に入る
  for l in label_uniq:
    med_uniq[l] = np.median(meds[l])

  # 各クラスの外れ値の中央絶対偏差(MAD)を求める
  mads = {}
  for n,l in enumerate(label):
    if l not in mads.keys():
      mads[l] = []
    mads[l].append(np.abs(out[n] - med_uniq[l]))

  mad_uniq = {} # 実際の各クラスのMADはこの変数に入る
  for l in label_uniq:
    mad_uniq[l] = np.median(mads[l])

  # 各データの外れ値を中央値,MADで正規化する
  outlier = [0] * N
  for n,l in enumerate(label):
    if mad_uniq[l] == 0.0:
      outlier[n] = out[n] - med_uniq[l]
    else:
      outlier[n] = (out[n] - med_uniq[l]) / mad_uniq[l]

  return outlier
サンプル
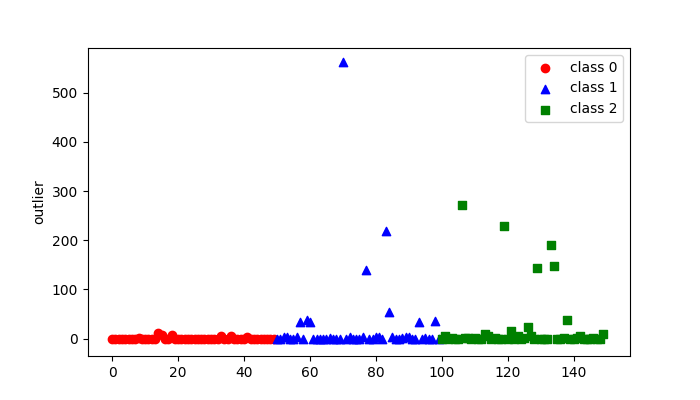
上記の関数を使って,sklearnのサンプルデータにあるirisの外れ値を特定してみました.
この結果の画像出力まで行うサンプルコードを次で載せています.
コード
from sklearn.datasets import load_iris
from sklearn.ensemble import RandomForestClassifier
import numpy as np
import matplotlib.pyplot as plt

def proximity(data):
  n_samples = np.zeros((len(data),len(data)))
  n_estimators = len(data[0])
  for e,est in enumerate(np.transpose(np.array(data))):
    for n,n_node in enumerate(est):
      for k,k_node in enumerate(est):
        if n_node == k_node:
          n_samples[n][k] += 1
  n_samples = 1.0 * np.array(n_samples) / n_estimators
  return n_samples

def outlier(data, label):
  N = len(label)
  pbar = [0] * N
  data = np.square(data)

  # クラス内の近似度の平均値を求める
  for n,n_prox2 in enumerate(data):
    for k,k_prox2 in enumerate(n_prox2):
      if label[n] == label[k]:
        pbar[n] += k_prox2
    if pbar[n] == 0.0:
      pbar[n] = 1.0e-32

  # 外れ値を求める
  out = N / np.array(pbar)

  # 各クラスの外れ値の中央値を求める
  meds = {}
  for n,l in enumerate(label):
    if l not in meds.keys():
      meds[l] = []
    meds[l].append(out[n])

  label_uniq = list(set(label))
  med_uniq = {} # 実際の各クラスの中央値はこの変数に入る
  for l in label_uniq:
    med_uniq[l] = np.median(meds[l])

  # 各クラスの外れ値の中央絶対偏差(MAD)を求める
  mads = {}
  for n,l in enumerate(label):
    if l not in mads.keys():
      mads[l] = []
    mads[l].append(np.abs(out[n] - med_uniq[l]))

  mad_uniq = {} # 実際の各クラスのMADはこの変数に入る
  for l in label_uniq:
    mad_uniq[l] = np.median(mads[l])

  # 各データの外れ値を中央値,MADで正規化する
  outlier = [0] * N
  for n,l in enumerate(label):
    if mad_uniq[l] == 0.0:
      outlier[n] = out[n] - med_uniq[l]
    else:
      outlier[n] = (out[n] - med_uniq[l]) / mad_uniq[l]

  return outlier


if __name__ == '__main__':
  iris = load_iris()
  X = iris.data
  y = iris.target
  div = 50
  best_oob = len(y)

  for i in range(20):
    rf = RandomForestClassifier(max_depth=5,n_estimators=10,oob_score=True)
    rf.fit(X, y)
    if best_oob > rf.oob_score:
      app = rf.apply(X)

  prx = proximity(app)
  out = outlier(prx,y)

  fig = plt.figure(figsize=[7,4])
  ax = fig.add_subplot(1,1,1)

  ax.scatter(np.arange(div),out[:div], c="r",marker='o', label='class 0')
  ax.scatter(np.arange(div,div*2),out[div:div*2], c="b",marker='^', label='class 1')
  ax.scatter(np.arange(div*2,div*3),out[div*2:], c="g",marker='s', label='class 2')

  ax.set_ylabel('outlier')
  ax.legend(loc="best")
  fig.savefig("out.png")

