はじめに
セルの値を区切り文字で分離して複数行に展開するtidyr::separate_longer_delim()関数や複数列に展開するtidyr::separate_wider_delim()関数を使う機会があったので,忘れないうちにメモしておきます.
データ
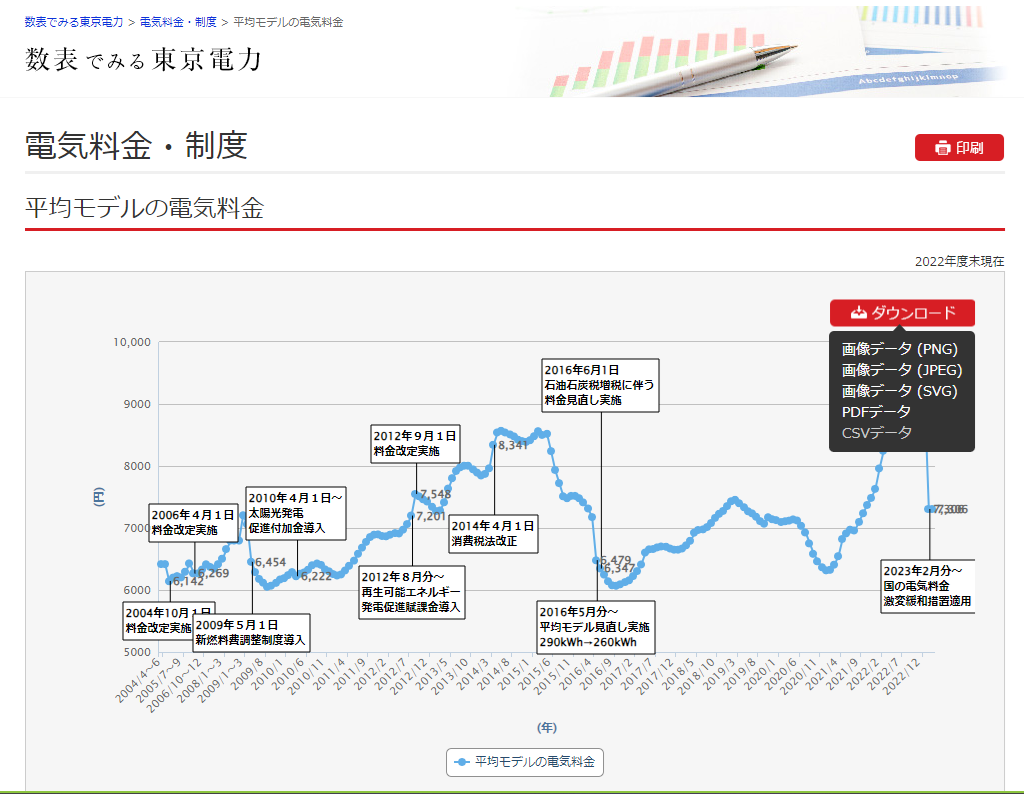
東京電力ホールディングスのWebサイトに数表で見る東京電力というページがあり,そこでは東京電力に関わる色々なデータをダウンロードすることができます.
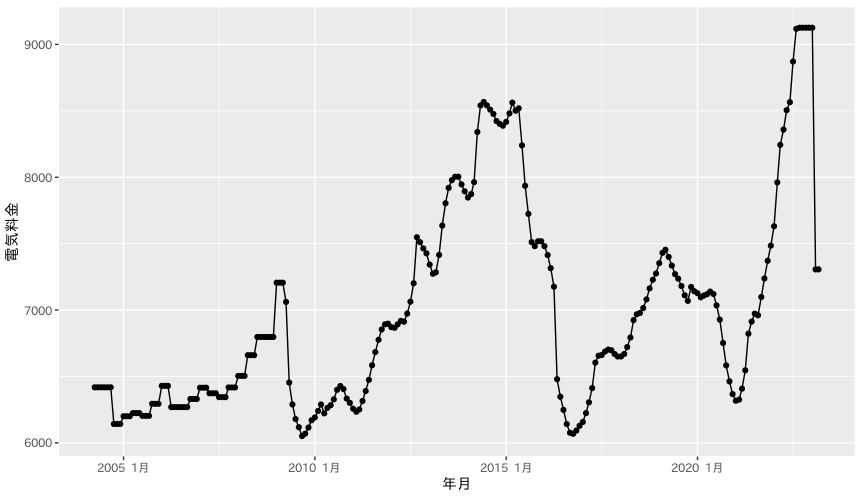
今回は平均モデルの電気料金のデータをダウンロードし,このページにあるグラフを再現したいと思います.
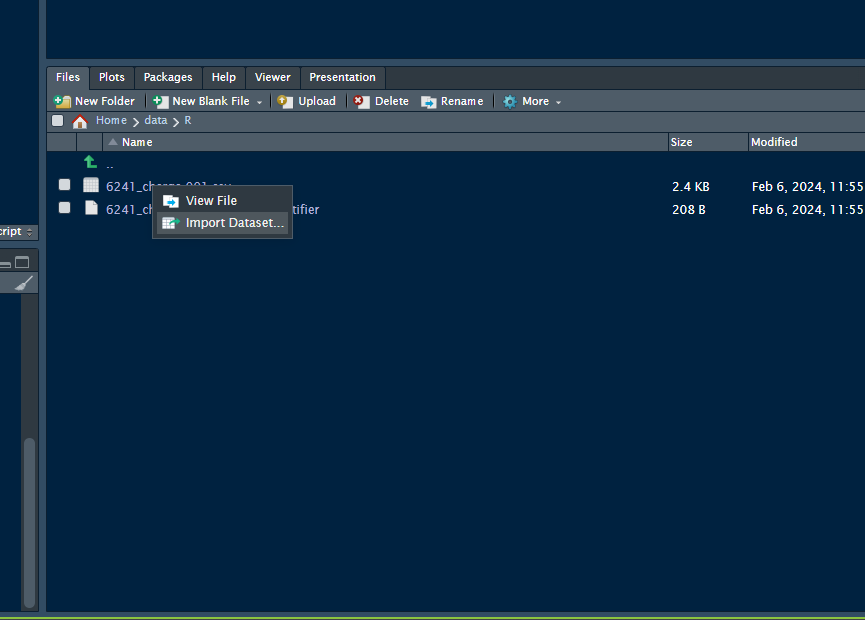
早速データをダウンロードします.
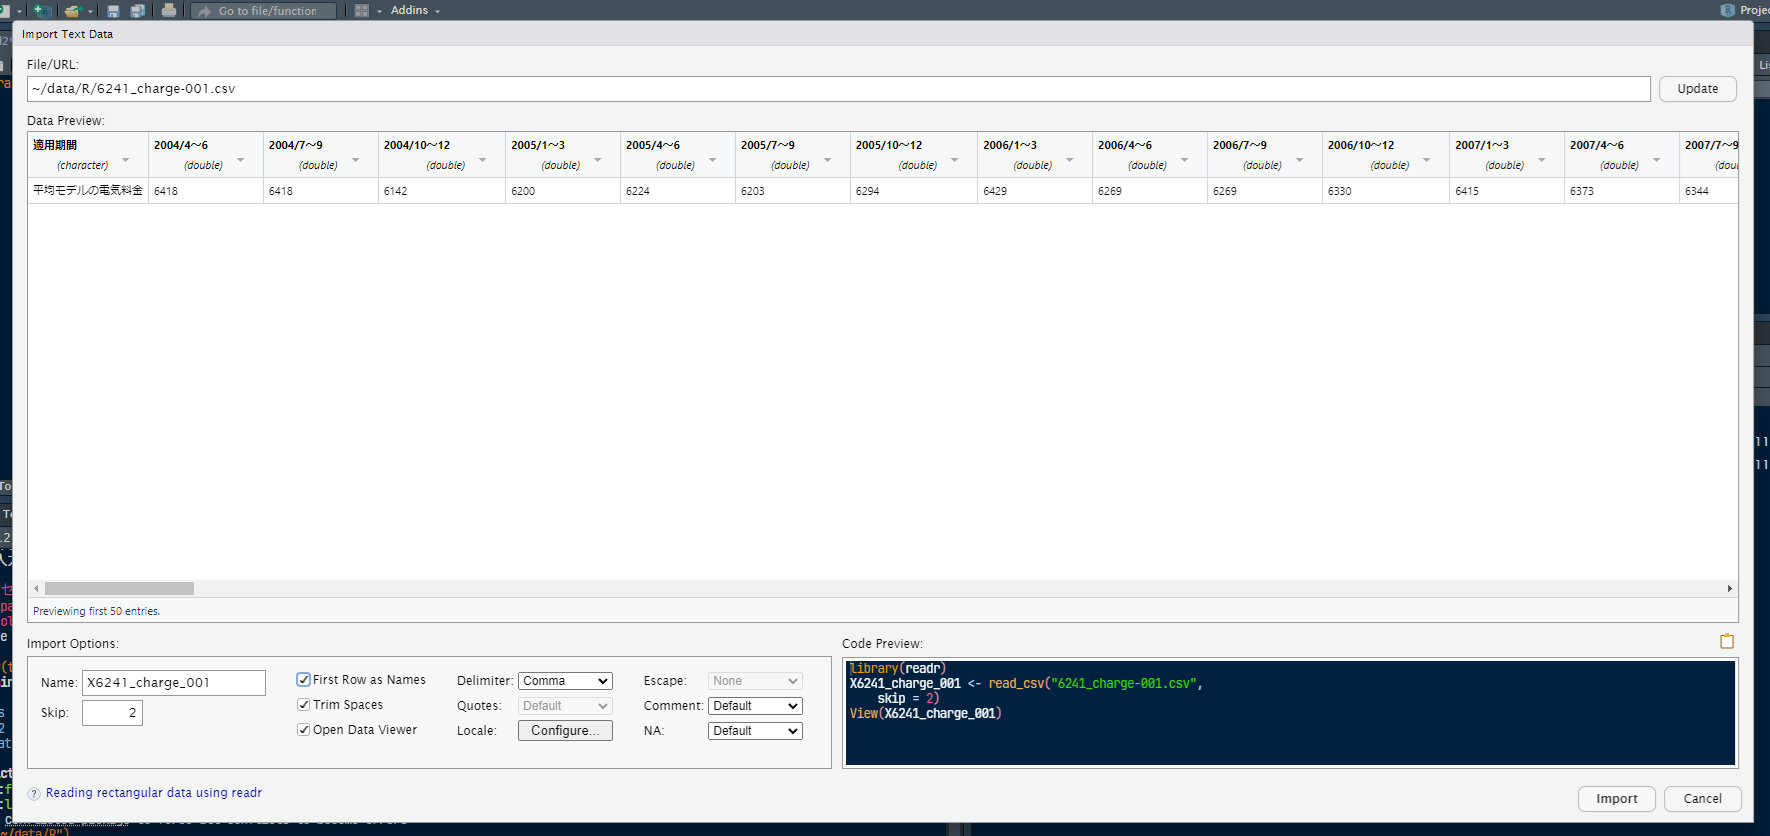
ダウンロードした6241_change-001.csvを適当なディレクトリに移動し,RStudioでインポートしてみます.
2行スキップすれば読み込めそうです.縦横は後で入れ替えることにします.
ということでdf_chargeというデータフレームに読み込むことにします.
library(tidyverse)

X6241_charge_001 <- read_csv("6241_charge-001.csv", skip = 2)
df_charge <- as_tibble(
  cbind(
    適用期間 = names(X6241_charge_001)[-1],
    電気料金 = t(X6241_charge_001)[-1]
    )
  ) |>
  mutate(電気料金 = as.numeric(電気料金))
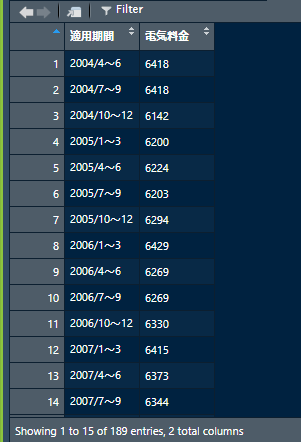
できあがったデータフレームは四半期毎のデータのようです.
ん?
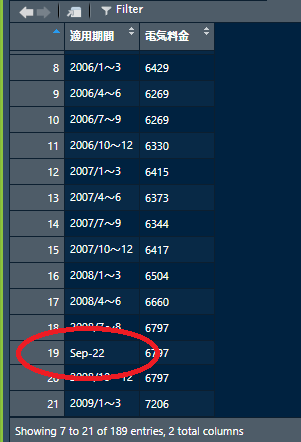
んんん?
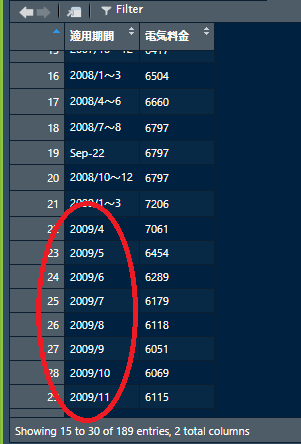
どうも四半期毎になっているのは2009年の第1四半期までで,それ以降は月次のデータとなっているようです1.そこで,このデータフレーム全体を月次データとして変換することにします.そのために,四半期毎になっている行については,電気料金の値を3ヶ月分複製した行を挿入します.
処理
つまり,
| 適用期間 | 電気料金 |
|---|---|
| 2009/1~3 | 7206 |
という行を
| 適用期間 | 電気料金 |
|---|---|
| 2009/01 | 7206 |
| 2009/02 | 7206 |
| 2009/03 | 7206 |
という3行に変換したいわけです.
下準備として適用期間の値を年と月を表す列に/で分割するために,separate_wider_delim()関数を使います.
df_charge <- df_charge |>
  separate_wider_delim(
    適用期間,
    delim = "/",
    names = c("年", "月"),
    too_few = "align_start"
    )

df_charge
# A tibble: 189 × 3
   年    月     電気料金
   <chr> <chr>     <dbl>
 1 2004  4~6       6418
 2 2004  7~9       6418
 3 2004  10~12     6142
 4 2005  1~3       6200
 5 2005  4~6       6224
 6 2005  7~9       6203
 7 2005  10~12     6294
 8 2006  1~3       6429
 9 2006  4~6       6269
10 2006  7~9       6269
# ℹ 179 more rows
# ℹ Use `print(n = ...)` to see more rows
too_few = "align_start"は2つに分割できない場合(Sep-22のケース)に先頭から値を埋めて,残りにNAを入れることを指定しています.
df_charge |>
  filter(年 == "Sep-22")
# A tibble: 1 × 3
  年     月    電気料金
  <chr>  <chr>    <dbl>
1 Sep-22 NA        6797
次に7~9などの四半期のラベルを,カンマ区切りの数字(7,8,9など)で置換し,2008年9月の値も処理します.
df_charge <- df_charge |>
  mutate(
    月 = if_else(is.na(月), "9", 月),
    月 = case_when(
      月 == "1~3" ~ "1,2,3",
      月 == "4~6" ~ "4,5,6",
      月 == "7~9" ~ "7,8,9",
      月 == "10~12" ~ "10,11,12",
      月 == "7~8" ~ "7,8",
      TRUE ~ 月
      ),
    年 = if_else(年 == "Sep-22", "2008", 年)
    )
この月列に対してseparate_longer_delim()関数を使います.
df_charge <- df_charge |>
  separate_longer_delim(月, delim = ",")

df_charge
# A tibble: 228 × 3
   年    月    電気料金
   <chr> <chr>    <dbl>
 1 2004  4         6418
 2 2004  5         6418
 3 2004  6         6418
 4 2004  7         6418
 5 2004  8         6418
 6 2004  9         6418
 7 2004  10        6142
 8 2004  11        6142
 9 2004  12        6142
10 2005  1         6200
# ℹ 218 more rows
# ℹ Use `print(n = ...)` to see more rows
データフレーム全体の行数も189行から228行に増えていることが分かります.
最後に折れ線グラフを描いて完成です.
library(tsibble)

df_charge |>
  mutate(年月 = make_yearmonth(year = 年, month = 月)) |>
  select(年月, 電気料金) |>
  as_tsibble(index = 年月) |>
  ggplot(aes(x = 年月, y = 電気料金)) +
  geom_point() + geom_line()
終わりに
今回のケースであれば欠落データはなさそうですので,tidyr::uncount()関数を使って行をコピーしてから,別途作成したインデックスと組み合わせても実現できると思います.
それにしてもどうやったらこんなヘンテコなデータができるんでしょうかね?
-
よく見ると上の東京電力ホールディングスのページにあるグラフも横軸が等間隔にはなってないですね. ↩