はじめに
最近の個人的なブームはブロックチェーン・仮想通貨です。
それに伴って(?)仮想通貨など考えるならば、株価を、機械学習で予測することのほうが良いのではないかと思い立った次第です。
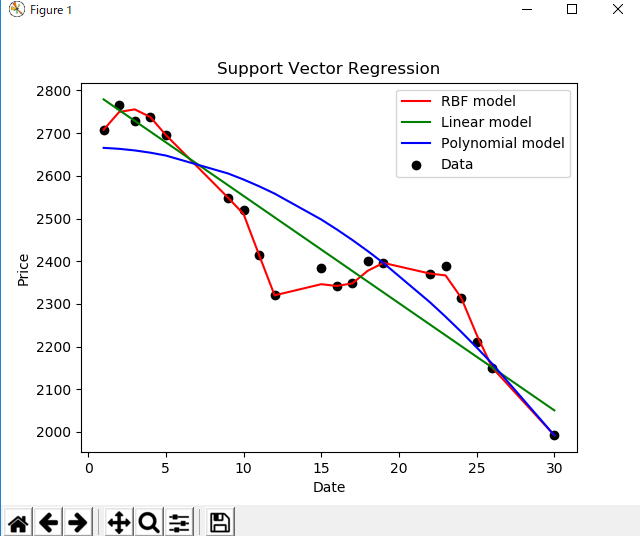
とりあえず、データを集めて、それを機械学習のライブラリ(scikit-learnのSVM)に投入してモデルごとの結果を図示化を行いました。
厳密にいえば、今回のものは将来予測ではなく最適収斂モデルなので微妙に違うところもありますが。。
しかしこれは第一弾で、投入データを増やす、モデルをKeras,Tensorflow,chainerなどのやつにする、海外の文献をあさるなど今後に取りうる方針はいろいろありますが、まずはメモ書き残し用途です。
結果
ソースコード
import csv
import numpy as np
from sklearn.svm import SVR
import matplotlib.pyplot as plt

dates = []
prices = []

def get_data(filename):
    with open(filename, 'r') as csvfile:
        csvFileReader = csv.reader(csvfile)
        next(csvFileReader)
        next(csvFileReader)
        for row in csvFileReader:
            dates.append(int(row[0].split('-')[2]))
            prices.append(float(row[1]))
    return

def predict_price(dates, prices, x):
    dates = np.reshape(dates, (len(dates), 1))

    svr_lin = SVR(kernel='linear', C=1e3)
    svr_poly = SVR(kernel='poly', C=1e3, degree=2)
    svr_rbf = SVR(kernel='rbf', C=1e3, gamma=0.1)
    svr_lin.fit(dates, prices)
    svr_poly.fit(dates, prices)
    svr_rbf.fit(dates, prices)

    plt.scatter(dates, prices, color='black', label='Data')
    plt.plot(dates, svr_rbf.predict(dates), color='red', label='RBF model')
    plt.plot(dates, svr_lin.predict(dates), color='green',
             label='Linear model')
    plt.plot(dates, svr_poly.predict(dates), color='blue',
             label='Polynomial model')
    plt.xlabel('Date')
    plt.ylabel('Price')
    plt.title('Support Vector Regression')
    plt.legend()
    plt.show()

    return svr_rbf.predict(x)[0], svr_lin.predict(x)[0], svr_poly.predict(x)[0]


get_data('2181_2018_10.csv')
predicted_price = predict_price(dates, prices, 29)
元データの取得サイト
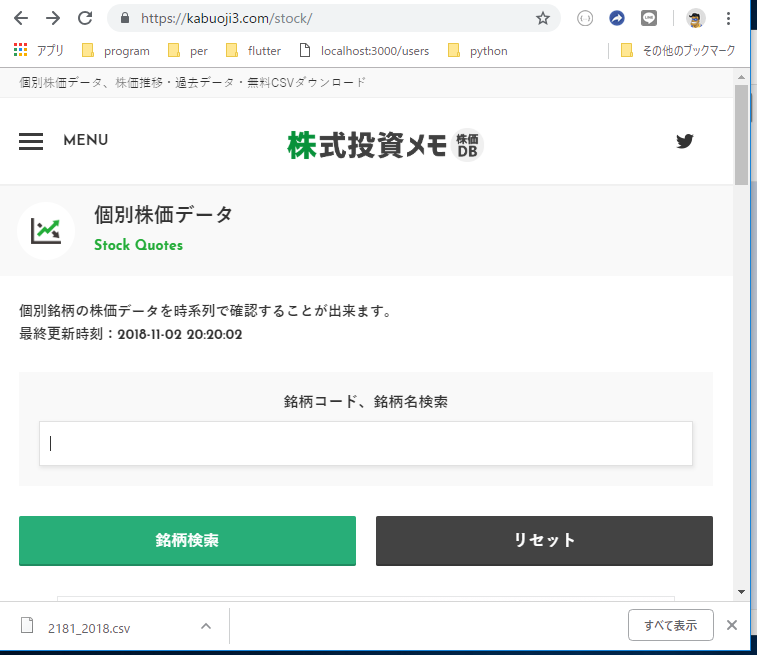
データは以下のサイトよりCSV形式で配布されています
1CSV=1銘柄、1年間分。にて取得可。
株式投資メモ

処理の流れ
- 株価のCSVファイルを用意
- csvファイルの月初から月末までの29日間の株価を取得、
- モデルにfitさせる
- 結果をmatplotlibにて表示する
ライブラリ
scikit-learnを使用。
Pythonにてメジャーな機械学習ライブラリ。
今回はscilit-learnの中でもSVMを使用。
SVMの中でも
- Polynomial
- Liner
- RBF
という3つの手法を選定。違いは以下サイトご参照のこと
結果によって、他のライブラリの使用も検討する。
SVMってなによ。。
サポートベクターマシーン
概要は以下サイト様の記述を参考として。。。
サポートベクターマシン(SVM)は、1995年頃にAT&TのV.Vapnikが発表したパターン識別用の教師あり機械学習方法であり、局所解収束の問題が無い長所がある。
「マージン最大化」というアイデア等で汎化能力も高め、現在知られている方法としては、最も優秀なパターン識別能力を持つとされている。
...
データを2つのグループに分類する問題には優れているが、多クラスの分類にそのまま適用出来ず、計算量が多い、カーネル関数の選択の基準も無い等の課題
...
学習データによる識別線によって、多くの未学習データの判別が可能になる事を「汎化能力」という。最大マージンの真ん中に引いた線が、最も汎化能力が高い事が期待出来る。
感想
Liner,Polynomialは実用不可だな。
次はChart.jsやDjangoでwebアプリ化するもよし、
モデルor投入データを検討して、予測性能を向上させるもよし。
結構楽しみ。
