JDAL E資格の受験用に、機械学習を勉強した備忘録
1. 線形回帰モデル
ある入力(離散あるいは連続値)から出力(連続値)を予測する問題
・直線で予測⇒線形回帰
・回帰問題を解くための機械学習(以下ML)モデルの一つ
・教師あり学習
・入力と$m$次元パラメータの線形結合を出力するモデル
パラメータ:$w=(w_1,w_2,w_3,\cdots,w_n)^T\in\mathbb{R^n}$
線形結合:$\hat{y}=w^Tx+b_1=\sum_{k=1}^n x_k w_k+b_1$
パラメータ推定には平均二乗誤差が最小となるような探索を行う最小二乗法を用いる
平均二乗誤差(MSE):$MSE_{\rm train}=\frac{1}{n_{\rm train}}\sum_{k=1}^{n_{\rm train}}\Big(\hat{y_k}-y_k\Big)^2$
<実装演習>
ボストンの住宅データセットを用いて、部屋数4・犯罪率0.3の物件はいくらになるか予測
import pandas as pd
from sklearn.datasets import load_boston
from sklearn.linear_model import LinearRegression

boston = load_boston()
X = pd.DataFrame(boston.data, columns = boston.feature_names)
X = X.loc[:, ["RM", "CRIM"]]
y = pd.DataFrame(boston.target, columns = ["PRICE"])

linear = LinearRegression()
linear.fit(X, y)
linear.predict([[4, 0.3]])
結果:array([[4.24007956]])
⇒$4240 となる
2. 非線形回帰モデル
線形回帰モデルの入力の部分に基底関数と呼ばれる既知の非線形関数を
適用することでモデルの表現力を上げたもの
入力とm次元パラメータwの線形結合を出力するモデル
yについては、下記の式であらわされる :
y_{i}= w_{0} + \sum_{i=1}^m w_j \phi_{j}(x_{i}) + \epsilon_i
基底関数$\phi_{j}(x)$には、多項式(1~9次)やガウス基底がある。
基底展開法も線形回帰と同じ枠組みで推定可能。
多項式:$\phi_{j}(x)=x^j$
ガウス基底:$\phi_{j}(x)=( - \dfrac{(x-\mu_j)^T(x-\mu_j)}{2h_j})$
・未学習(underfitting)
学習データに対して、十分小さな誤差が得られないモデル
⇒モデルの表現力が低いため、表現力の高いモデルを利用する
・過学習(overfitting)
小さな誤差は得られたけど、テスト集合誤差との差が大きいモデル
対策
1.学習データの数を増やす
2.不要な基底関数(変数)を削除して表現力を抑止
⇒解きたい問題に対して多くの基底関数を用意してしまうと過学習の問題が
おこるため適切な基底関数を用意(CVなどで選択)
3.正則化法を利用して表現力を抑止
⇒正則化項にL2ノルムを利用する場合をリッジ、
L1ノルムを利用する場合をラッソという。
<実装演習>
関数$f(x)=1−48x+218x2−315x3+145x4$に対し、
ノイズを加える事によって、非線形データを作成
# 与えられた関数にノイズデータを与え、データを生成
import numpy as np
import matplotlib.pyplot as plt
import matplotlib.style
from sklearn.linear_model import LinearRegression, Ridge, Lasso
from sklearn.metrics.pairwise import rbf_kernel

np.random.seed(5)

def true_func(x):
  y = 1 - 48 * x + 218 * x ** 2 - 315 * x ** 3 + 145 * x ** 4
  return y

n = 100
X = np.random.rand(n)
X = np.sort(X)
y = true_func(X) + 0.5 * np.random.randn(n)
fig, ax = plt.subplots()
ax.set_xlabel("X")
ax.set_ylabel("y")
plt.scatter(X, y,color = "k")
plt.legend(loc=2)
上記のデータを用いて非線形回帰を実施
・RBFカーネル適用の非線形回帰モデル
・リッジ回帰
・ラッソ回帰
X = X.reshape(-1, 1)
y = y.reshape(-1, 1)

kX = rbf_kernel(X, X)

linear = LinearRegression()
linear.fit(kX, y)
y_pred_linear = linear.predict(kX)

ridge = Ridge(alpha = 0.00001)
ridge.fit(kX, y)
y_pred_ridge = ridge.predict(kX)

lasso = Lasso(alpha = 0.00001)
lasso.fit(kX, y)
y_pred_lasso = lasso.predict(kX)

fig, ax = plt.subplots()
ax.scatter(X, y, color = "k")
ax.plot(X, true_func(X), label = "True", color = "r")
ax.plot(X, y_pred_linear, label = "LinearRegression", color = "g")
ax.plot(X, y_pred_ridge, label = "Ridge", color = "b")
ax.plot(X, y_pred_lasso, label = "Lasso", color = "y")
ax.set_xlabel("X")
ax.set_ylabel("y")
ax.legend(loc = "best")
plt.show()
・赤線(True):ノイズを与える前のベース関数
・緑線(LinearRegression):RBFカーネルの非線形モデル⇒過学習気味
・青線(Ridge):Ridge回帰 ほぼベースの関数に近い
・黄線(Lasso):Lasso回帰 データに合っていない⇒このデータには適していない
3. ロジスティック回帰モデル
・分類問題(クラス分類)
入力データ:m次元のベクトル(説明変数、特徴量)
出力データ:0 or 1の値 (タイタニックデータの目的変数:生存、死亡など)
・ロジスティック回帰
分類問題を解くための教師あり機械学習モデル(教師データから学習)
入力とm次元パラメータの線形結合をシグモイド関数に入力
出力はy=1になる確率の値になる
パラメータ:$w=(w_1,w_2,w_3,\cdots,w_n)^T\in\mathbb{R^n}$
線形結合:$\hat{y}=w^Tx+b_1=\sum_{k=1}^n x_k w_k+b_1$
ここまでは、線形回帰と同じで、この値をシグモイド関数に入力
(入力:実数、出:必ず 0~1の値)
\sigma(x)=\dfrac{1}{1+e^{-ax}}
シグモイド関数の出力をY=1になる確率に対応させる
P(Y=1|x)=σ(w0+w1x1+w2x2+w3x3+⋯+wmxn)
データYは確率が0.5以上ならば1・未満なら0と予測 ($σ$:シグモイド関数)
ロジスティクス回帰では、パラメータの推定に、最尤法または確率的勾配降下法を使う
<実装演習>
タイタニックの乗客データを用いて、30歳・男の乗客は生き残れるか予測
import pandas as pd
from pandas import DataFrame
import numpy as np
import matplotlib.pyplot as plt
from sklearn.linear_model import LogisticRegression

titanic = pd.read_csv("/content/drive/MyDrive/ラビットチャレンジ/study_ai_ml_google/data/titanic_train.csv")

## Ageカラムのnullを中央値で補完し、"AgeFill"というフィールドに格納
titanic["AgeFill"] = titanic["Age"].fillna(titanic["Age"].mean())

# 女性、男性をそれぞれ0と1に置き換え、"Gender"というフィールドに格納
titanic["Gender"] = titanic["Sex"].map({"female" : 0, "male" : 1}).astype(int)
X = titanic.loc[:, ["AgeFill", "Gender"]]
y = titanic.loc[:, "Survived"]

logistic = LogisticRegression()
logistic.fit(X, y)
logistic.predict_proba([[30, 1]])
array([[0.80668102, 0.19331898]])
⇒死亡率が80.7%なので予測としては死亡
4. 主成分分析
多変量データの情報をなるべく保ったまま指標の数を減らす方法。次元削減やデータの可視化に用いられる
分散が最大となる射影軸を探索する、
最初の軸を第一主成分と呼び、続く軸はそれまでの軸と直交する条件下で選択される。軸の数が次元数を示す。
寄与率、累積寄与率といった指標を用いて情報の損失量を確認する。
<実装演習>
・乳がん検査データを利用しロジスティック回帰モデルにて学習
・主成分分析を利用し2次元空間上に次元圧縮しロジスティック回帰にて学習
・32次元のデータを2次元上に次元圧縮した際に、うまく判別できるか?
import pandas as pd
from sklearn.model_selection import train_test_split
from sklearn.preprocessing import StandardScaler
from sklearn.linear_model import LogisticRegressionCV
from sklearn.metrics import confusion_matrix
from sklearn.decomposition import PCA
import matplotlib.pyplot as plt

cancer_df = pd.read_csv('/content/drive/MyDrive/ラビットチャレンジ/study_ai_ml_google/data/cancer.csv')
cancer_df.drop('Unnamed: 32', axis=1, inplace=True)
y = cancer_df.diagnosis.apply(lambda d: 1 if d == 'M' else 0)
X = cancer_df.loc[:, 'radius_mean':]

# 学習用とテスト用でデータを分離
X_train, X_test, y_train, y_test = train_test_split(X, y, random_state=0)

# 標準化
scaler = StandardScaler()
X_train_scaled = scaler.fit_transform(X_train)
X_test_scaled = scaler.transform(X_test)

# ロジスティック回帰で学習
logistic = LogisticRegressionCV(cv=10, random_state=0, max_iter=1000)
logistic.fit(X_train_scaled, y_train)

# 検証
print('Train score: {:.3f}'.format(logistic.score(X_train_scaled, y_train)))
print('Test score: {:.3f}'.format(logistic.score(X_test_scaled, y_test)))
print('Confustion matrix:\n{}'.format(confusion_matrix(y_true=y_test, y_pred=logistic.predict(X_test_scaled))))
Train score: 0.988
Test score: 0.972
Confustion matrix:
[[89 1]
[ 3 50]]
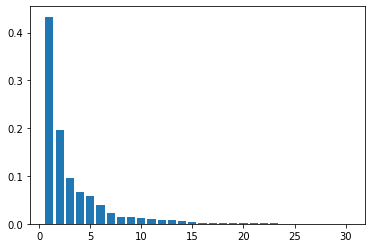
寄与率の表示
pca = PCA(n_components=30)
pca.fit(X_train_scaled)
plt.bar([n for n in range(1, len(pca.explained_variance_ratio_)+1)], pca.explained_variance_ratio_)
主成分分析を利用し2次元空間上に次元圧縮しロジスティック回帰にて学習
# PCA後のデータでロジスティック回帰で学習
pca = PCA(n_components = 2)
X_train_pca = pca.fit_transform(X_train_scaled)
X_test_pca = pca.fit_transform(X_test_scaled)

# logistic = LogisticRegressionCV(cv=10, random_state=0, max_iter=1000)
logistic.fit(X_train_pca, y_train)

# 検証
print('Train score: {:.3f}'.format(logistic.score(X_train_pca, y_train)))
print('Test score: {:.3f}'.format(logistic.score(X_test_pca, y_test)))
print('Confustion matrix:\n{}'.format(confusion_matrix(y_true=y_test, y_pred=logistic.predict(X_test_pca))))
Train score: 0.965
Test score: 0.916
Confustion matrix:
[[83 7]
[ 5 48]]
主成分分析前のテスト結果:Test score: 0.972
主成分分析後のテスト結果:Test score: 0.916
特徴量を2次元まで削減すると5.6%の低下となった。
おおむね分類できている。
可視化してみる
# PCA後を散布図にプロット
temp = pd.DataFrame(X_train_pca)
temp['Outcome'] = y_train.values
b = temp[temp['Outcome'] == 0]
m = temp[temp['Outcome'] == 1]
plt.scatter(x=b[0], y=b[1], marker='o') # 良性は○
plt.scatter(x=m[0], y=m[1], marker='^') # 悪性は△
plt.xlabel('PC 1') # 第1主成分をx軸
plt.ylabel('PC 2') # 第2主成分をy軸
重なりができているので、そこで誤判定していると思わるが、特徴は捉えられている
5. アルゴリズム
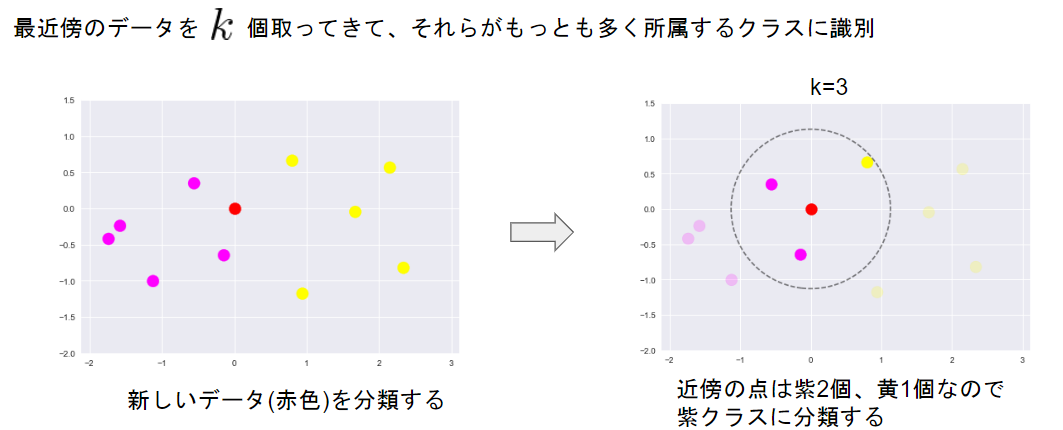
・k近傍法
k近傍法は分類問題のための機械学習手法であり、最近傍のデータを個取ってきて、
それらがもっとも多く所属するクラスに識別する方法である。kを大きくすると決定境界は滑らかになる。
<実装>
ランダムな2クラスのプロットを作成
%matplotlib inline
import numpy as np
import matplotlib.pyplot as plt
from scipy import stats
def gen_data():
    x0 = np.random.normal(size=50).reshape(-1, 2) - 1
    x1 = np.random.normal(size=50).reshape(-1, 2) + 1.
    x_train = np.concatenate([x0, x1])
    y_train = np.concatenate([np.zeros(25), np.ones(25)]).astype(np.int)
    return x_train, y_train
X_train, ys_train = gen_data()
plt.scatter(X_train[:, 0], X_train[:, 1], c=ys_train)
これをベースに学習してみる
def distance(x1, x2):
    return np.sum((x1 - x2)**2, axis=1)

def knc_predict(n_neighbors, x_train, y_train, X_test):
    y_pred = np.empty(len(X_test), dtype=y_train.dtype)
    for i, x in enumerate(X_test):
        distances = distance(x, X_train)
        nearest_index = distances.argsort()[:n_neighbors]
        mode, _ = stats.mode(y_train[nearest_index])
        y_pred[i] = mode
    return y_pred

def plt_resut(x_train, y_train, y_pred):
    xx0, xx1 = np.meshgrid(np.linspace(-5, 5, 100), np.linspace(-5, 5, 100))
    xx = np.array([xx0, xx1]).reshape(2, -1).T
    plt.scatter(x_train[:, 0], x_train[:, 1], c=y_train)
    plt.contourf(xx0, xx1, y_pred.reshape(100, 100).astype(dtype=np.float), alpha=0.2, levels=np.linspace(0, 1, 3))
n_neighbors = 3

xx0, xx1 = np.meshgrid(np.linspace(-5, 5, 100), np.linspace(-5, 5, 100))
X_test = np.array([xx0, xx1]).reshape(2, -1).T

y_pred = knc_predict(n_neighbors, X_train, ys_train, X_test)
plt_resut(X_train, ys_train, y_pred)
・k平均法(k-means)
k平均法もクラスの分類手法の1つとなるが、k近傍法との明確な違いとしては、
k平均法はクラスタリング手法という手法であり、教師なし学習の分類問題とみなす。
k-means法では、初期のセントロイドの位置をランダムで行うため、うまく分類できない場合があった。
k-means++法では、初期のセンドロイドの位置は離れていたほうがよいとの考えを取り入れ
初期値依存問題の解決を試みている。
<実装>
%matplotlib inline
import numpy as np
import matplotlib.pyplot as plt
def gen_data():
    x1 = np.random.normal(size=(100, 2)) + np.array([-5, -5])
    x2 = np.random.normal(size=(100, 2)) + np.array([5, -5])
    x3 = np.random.normal(size=(100, 2)) + np.array([0, 5])
    return np.vstack((x1, x2, x3))
# データ作成
X_train = gen_data()
# データ描画
plt.scatter(X_train[:, 0], X_train[:, 1])
def distance(x1, x2):
    return np.sum((x1 - x2)**2, axis=1)

n_clusters = 3
iter_max = 100

# 各クラスタ中心をランダムに初期化
centers = X_train[np.random.choice(len(X_train), n_clusters, replace=False)]

for _ in range(iter_max):
    prev_centers = np.copy(centers)
    D = np.zeros((len(X_train), n_clusters))
    # 各データ点に対して、各クラスタ中心との距離を計算
    for i, x in enumerate(X_train):
        D[i] = distance(x, centers)
    # 各データ点に、最も距離が近いクラスタを割り当
    cluster_index = np.argmin(D, axis=1)
    # 各クラスタの中心を計算
    for k in range(n_clusters):
        index_k = cluster_index == k
        centers[k] = np.mean(X_train[index_k], axis=0)
    # 収束判定
    if np.allclose(prev_centers, centers):
        break
def plt_result(X_train, centers, xx):
    # データを可視化
    plt.scatter(X_train[:, 0], X_train[:, 1], c=y_pred, cmap='spring')
    # 中心を可視化
    plt.scatter(centers[:, 0], centers[:, 1], s=200, marker='X', lw=2, c='black', edgecolor="white")
    # 領域の可視化
    pred = np.empty(len(xx), dtype=int)
    for i, x in enumerate(xx):
        d = distance(x, centers)
        pred[i] = np.argmin(d)
    plt.contourf(xx0, xx1, pred.reshape(100, 100), alpha=0.2, cmap='spring')
y_pred = np.empty(len(X_train), dtype=int)
for i, x in enumerate(X_train):
    d = distance(x, centers)
    y_pred[i] = np.argmin(d)
xx0, xx1 = np.meshgrid(np.linspace(-10, 10, 100), np.linspace(-10, 10, 100))
xx = np.array([xx0, xx1]).reshape(2, -1).T

plt_result(X_train, centers, xx)
6. サポートベクターマシーン
サポートベクターマシーンは分類問題を解く手法として考案されたが、回帰問題にも応用可能。
分類境界に最も近いデータをサポートベクトル、分類境界とサポートベクトルの距離をマージンという。
マージンを最大化するような分類境界を探索する。
分類誤りを許容しない分類(完全分離可能な問題のみ対応)をハードマージン
多少の分類誤りを許容して使い勝手を上げた分類をソフトマージン
ソフトマージンの場合、マージン内に入るデータに対する誤差であるスラック変数を
最小化するような分類境界の探索が条件に加わる。
マージンの定義:決定境界から最近傍データまでのユークリッド距離
目的関数:最大マージン(距離)
\frac{| w^{\rm T}x_i+b| }{ | | x | |}=\frac{t_i( w^{\rm T}x_i+b) }{ | | x | |}
$w$(パラメータ)、$x$(説明変数)、$b$(切片)、$ti$(分類)
\min_{i}\frac{t_i( w^{\rm T}x_i+b) }{ | | w | |}
\max_{w,b}\bigg(\min_{i}\frac{t_i( w^{\rm T}x_i+b) }{ | | w | |}\bigg)
$ti(wTxi+b)=1ti(wTxi+b)=1$
$ti(wTxi+b)≧1ti(wTxi+b)≧1$
\max_{w.b}=\frac{1}{| | w | |}
<実装演習>
ランダムで2種のデータを作り、SVMをやってみる
%matplotlib inline
import numpy as np
import matplotlib.pyplot as plt

def gen_data():
    x0 = np.random.normal(size=50).reshape(-1, 2) - 2.
    x1 = np.random.normal(size=50).reshape(-1, 2) + 2.
    X_train = np.concatenate([x0, x1])
    ys_train = np.concatenate([np.zeros(25), np.ones(25)]).astype(np.int)
    return X_train, ys_train

    X_train, ys_train = gen_data()

X_train, ys_train = gen_data()
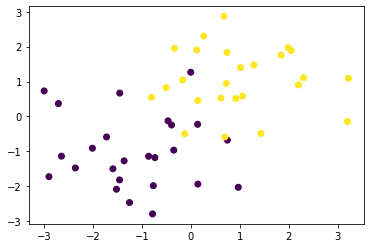
plt.scatter(X_train[:, 0], X_train[:, 1], c=ys_train)
黄色と紫のプロットが重なりなく分かれており
ハードマージンSVMで分類可能である
t = np.where(ys_train == 1.0, 1.0, -1.0)

n_samples = len(X_train)
# 線形カーネル
K = X_train.dot(X_train.T)

eta1 = 0.01
eta2 = 0.001
n_iter = 500

H = np.outer(t, t) * K

a = np.ones(n_samples)
for _ in range(n_iter):
    grad = 1 - H.dot(a)
    a += eta1 * grad
    a -= eta2 * a.dot(t) * t
    a = np.where(a > 0, a, 0)

    index = a > 1e-6
support_vectors = X_train[index]
support_vector_t = t[index]
support_vector_a = a[index]

term2 = K[index][:, index].dot(support_vector_a * support_vector_t)
b = (support_vector_t - term2).mean()


xx0, xx1 = np.meshgrid(np.linspace(-5, 5, 100), np.linspace(-5, 5, 100))
xx = np.array([xx0, xx1]).reshape(2, -1).T

X_test = xx
y_project = np.ones(len(X_test)) * b
for i in range(len(X_test)):
    for a, sv_t, sv in zip(support_vector_a, support_vector_t, support_vectors):
        y_project[i] += a * sv_t * sv.dot(X_test[i])
y_pred = np.sign(y_project)


# 訓練データを可視化
plt.scatter(X_train[:, 0], X_train[:, 1], c=ys_train)
# サポートベクトルを可視化
plt.scatter(support_vectors[:, 0], support_vectors[:, 1],
                    s=100, facecolors='none', edgecolors='k')
# 領域を可視化
# plt.contourf(xx0, xx1, y_pred.reshape(100, 100), alpha=0.2, levels=np.linspace(0, 1, 3))
# マージンと決定境界を可視化
plt.contour(xx0, xx1, y_project.reshape(100, 100), colors='k',
                     levels=[-1, 0, 1], alpha=0.5, linestyles=['--', '-', '--'])


