Machinist とは
IIJのサービスに、Machinistというものがあります。
メトリックを送信して、グラフにしてくれるサービスです。
「Getting Started」の「2. データの送信」にbashの例がありますが、これをPythonで書きました。
なお、この記事では、フリープランを利用しています。
環境
- Windows10
- Python 3.9.1
- Machinistサービス
APIキーの取得
メトリックを送信するために、APIキーが必要になります。
Machinist にログインすると、画面右上にMailアドレスが表示されます。
クリックすると、メニューが表示されるので、「アカウント設定」を選択します。
APIキーの項目があるので、コピーしておきます。
Pythonのコード
作るファイルは、2つです。同じディレクトリに置きます。
.config
必要なパラメータを記述します。
取得したAPIキーは、keyに記述します。
[machinst]
agent = Home
namespace = Environment Sensor
metric_name = temperature
key = XXXXXXXXXXXXX
machinist.py
流用がしやすそうなので、クラスにしています。
import configparser
import json
import requests


class metrics():
  '''
  Usage: metrics([config file])
  メトリックをIIJのmachinistサービスに送る。
  config_fileは、省略時には「.config」を参照する。
  '''
  URL = "https://gw.machinist.iij.jp/endpoint"

  def __init__(self, config_file=".config"):
    '''
    クラス作成時に、コンフィグファイルから情報取得する。
    '''
    config_ini = configparser.ConfigParser()
    config_ini.read(config_file, encoding="utf-8")
    self.machinst_agent = config_ini["machinst"]["agent"]
    self.machinst_namespace = config_ini["machinst"]["namespace"]
    self.machinst_metric_name = config_ini["machinst"]["metric_name"]
    self.machinst_key = config_ini["machinst"]["key"]

  def chk_params(self):
    '''
    コンフィグファイルから取得した情報の確認用
    '''
    print(metrics.URL)
    print(self.machinst_agent)
    print(self.machinst_namespace)
    print(self.machinst_metric_name)
    print(self.machinst_key)

  def send_metric(self, data):
    '''
    メトリックをサーバに送信する
    '''
    headers = {"Content-Type": "application/json", "Authorization": f"Bearer {self.machinst_key}"}
    body = {
        "agent": self.machinst_agent,
        "metrics": [
            {
                "name": self.machinst_metric_name,
                "namespace": self.machinst_namespace,
                "data_point": {
                    "value": data
                }
            }
        ]
    }

    result = requests.post(metrics.URL, data=json.dumps(body), headers=headers)
    return result


def get_metric():
  '''
  メトリックの取得
  '''
  metric = 27.6
  return metric


if __name__ == "__main__":
  mc = metrics()
#  mc.chk_params()
  data = get_metric()
  rc = mc.send_metric(data)

  if rc.status_code == 200:
    print("OK")
  else:
    print(f"NG: Return code {rc.status_code}")
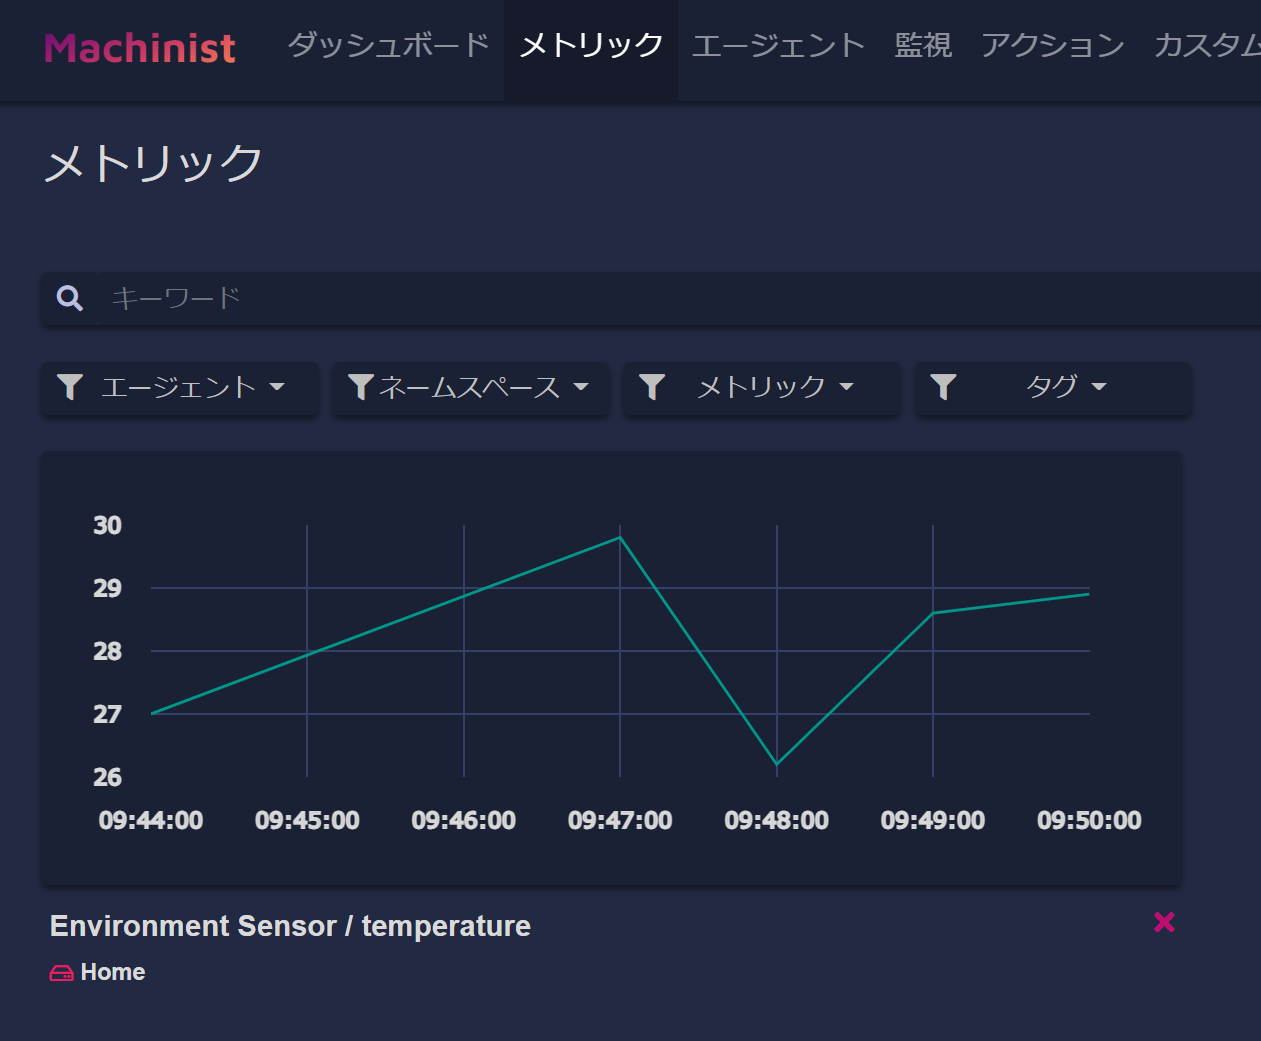
実行すると、このようなグラフが確認できます。
画像は、「ダークUI」に切り替えています。
 ドットが1つだけです。
get_metric()関数のmetricの値を変更しながら、何度が実行するとグラフらしくなります。

試していて気が付きましたが、1分間に1つだけプロットするようです。
毎分00秒~59秒の間に複数のメトリックを送信すると、最後に送信されたメトリックがプロットされました。
最後に
お手軽にメトリックをグラフ化できました。
Raspberry Piの温度など、いろいろ試していきたいです。
参考
Machinistの「Getting Started」 : https://machinist.iij.jp/