はじめに
階層型クラスタリングを勉強しているのですが、正解がない場合にクラスター数をどう決めればよいのかを調べてみました。間違っている点などありましたら、教えていただけると幸いです。
データの準備とクラスタリング
今回は、irisのデータセットを使ってみました。
from sklearn import datasets
dataset = datasets.load_iris()
dataset_data = dataset.data
dataset_target = dataset.target
target_names = dataset.target_names
dataset_labels = target_names[dataset_target]
とりあえず、標準化してみました。
# データの標準化を行う。
from sklearn.preprocessing import scale
data = scale(dataset_data)
今回は、完全リンク法を使ってクラスタリングしました。理由は、後ほど見やすいグラフを得るためであって、統計学的な意味はありません。
距離については、ユークリッド距離を使いました。後で出てくる指標の計算にユークリッド距離が用いられているためです。
# クラスタリングを行う。
from scipy.cluster.hierarchy import linkage
Z = linkage(data, method='complete', metric='euclidean')
クラスター数を評価する3つの指標
クラスタ数を決めるときに、参考となる指標はたくさんありますが、今回はscikit-learnで用意されている、以下の3つの指標を利用します。
-
シルエット係数(詳しくはこちら)
値が大きいほど良い。 -
Calinski Harabasz基準( pseudo Fとも呼ばれています。詳しくはこちら)
値が大きいほど良い。 -
Davies Bouldin基準(詳しくはこちら)
値が小さいほど良い。
scikit-learnでは、上記の指標はユークリッド距離で計算されています。そのため、**他の距離でのクラスタリングを評価する場合には、適切でないかもしれません。**他の距離を用いる場合は、自分で上記の指標を実装した方がよいかもしれません。その辺りは、調べてもよくわかりませんでした。どなたか教えていただけると幸いです。
# クラスタ数ごとに シルエット係数、Calinski Harabasz基準, Davies Bouldin基準を計算する。
from scipy.cluster.hierarchy import fcluster
from sklearn.metrics import silhouette_score, calinski_harabasz_score, davies_bouldin_score

silhouette_coefficient = []
calinski_harabasz_index = []
davies_bouldin_index = []

NUM_CLUSTERS_RANGE = range(2,11)  # クラスター数を2~10個の範囲で比較
for num in NUM_CLUSTERS_RANGE:
    labels = fcluster(Z, t=num, criterion='maxclust')

    silhouette_coefficient.append(silhouette_score(data, labels))
    calinski_harabasz_index.append(calinski_harabasz_score(data, labels))
    davies_bouldin_index.append(davies_bouldin_score(data, labels))
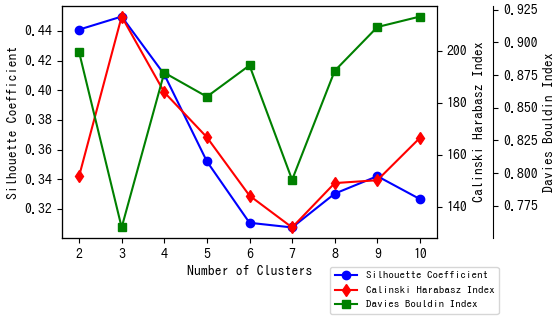
結果をグラフにします。こちらを参考にしました。
import matplotlib.pyplot as plt
fig = plt.figure()
fig.subplots_adjust(bottom=0.3,right=0.75)
host = fig.add_subplot(111)

# 縦軸の追加
par1 = host.twinx()
par2 = host.twinx()

# プロット
p0, = host.plot(NUM_CLUSTERS_RANGE, silhouette_coefficient, 'bo-', label='Silhouette Coefficient')
p1, = par1.plot(NUM_CLUSTERS_RANGE, calinski_harabasz_index, 'rd-', label='Calinski Harabasz Index')
p2, = par2.plot(NUM_CLUSTERS_RANGE, davies_bouldin_index, 'gs-', label='Davies Bouldin Index')

# 軸ラベル
host.set_xlabel('Number of Clusters')
host.set_ylabel('Silhouette Coefficient')
par1.set_ylabel('Calinski Harabasz Index')
par2.set_ylabel('Davies Bouldin Index')

# 軸の位置の調整
par2.spines['right'].set_position(('axes', 1.15))

# 凡例
lines = [p0, p1, p2]
host.legend(lines,
            [l.get_label() for l in lines],
            fontsize=8,
            bbox_to_anchor=(0.7, -0.1),
            loc='upper left')

fig.show()

グラフを見ると、クラスター数 3個が最適であると推察できます。
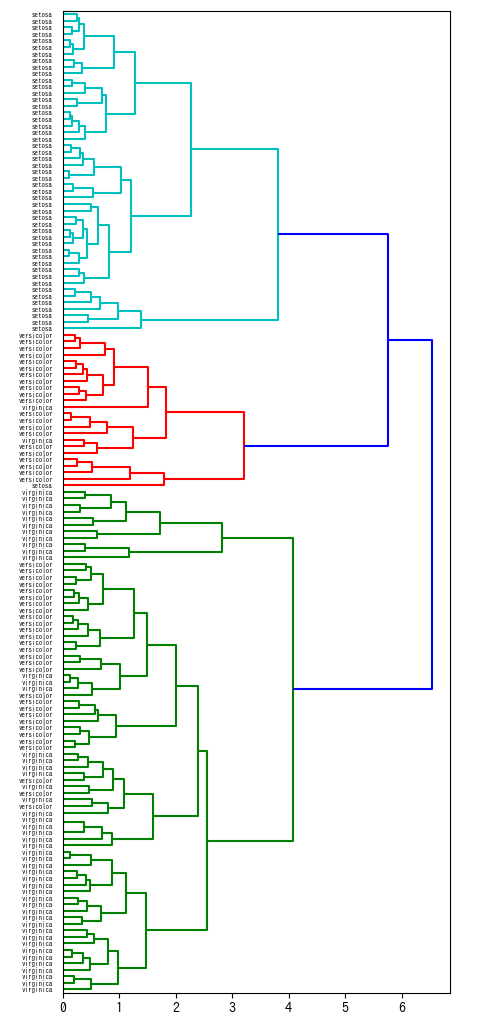
クラスター数3個でデンドログラムを色分けしてみました。
import numpy as np
from scipy.cluster.hierarchy import dendrogram
import matplotlib.pyplot as plt

NUM_CLUSTERS = 3
threshold = np.sort(Z[:, 2])[::-1][NUM_CLUSTERS-2]

fig2, ax2 = plt.subplots(figsize=(5,13))
ax2 = dendrogram(Z, color_threshold=threshold, orientation='right', labels=dataset_labels)

fig2.show()
最後に
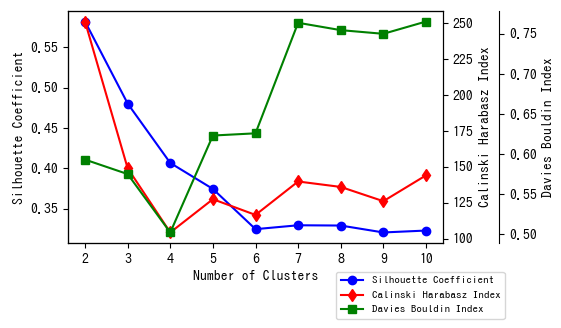
実は今回、完全リンク法以外は、クラスター数をうまく決定できないものがほとんどでした。指標のグラフがきれいにならないのです。例えば、UPGMA法の場合は以下のようなグラフになりました。このグラフでは、クラスター数4個において、Calinski Harabasz基準では最悪となり、Davies Bouldin基準では最良となっています。このように、この3つの指標だけでうまくいかないことも多々あり、これら以外の指標も利用する必要がありそうです。

