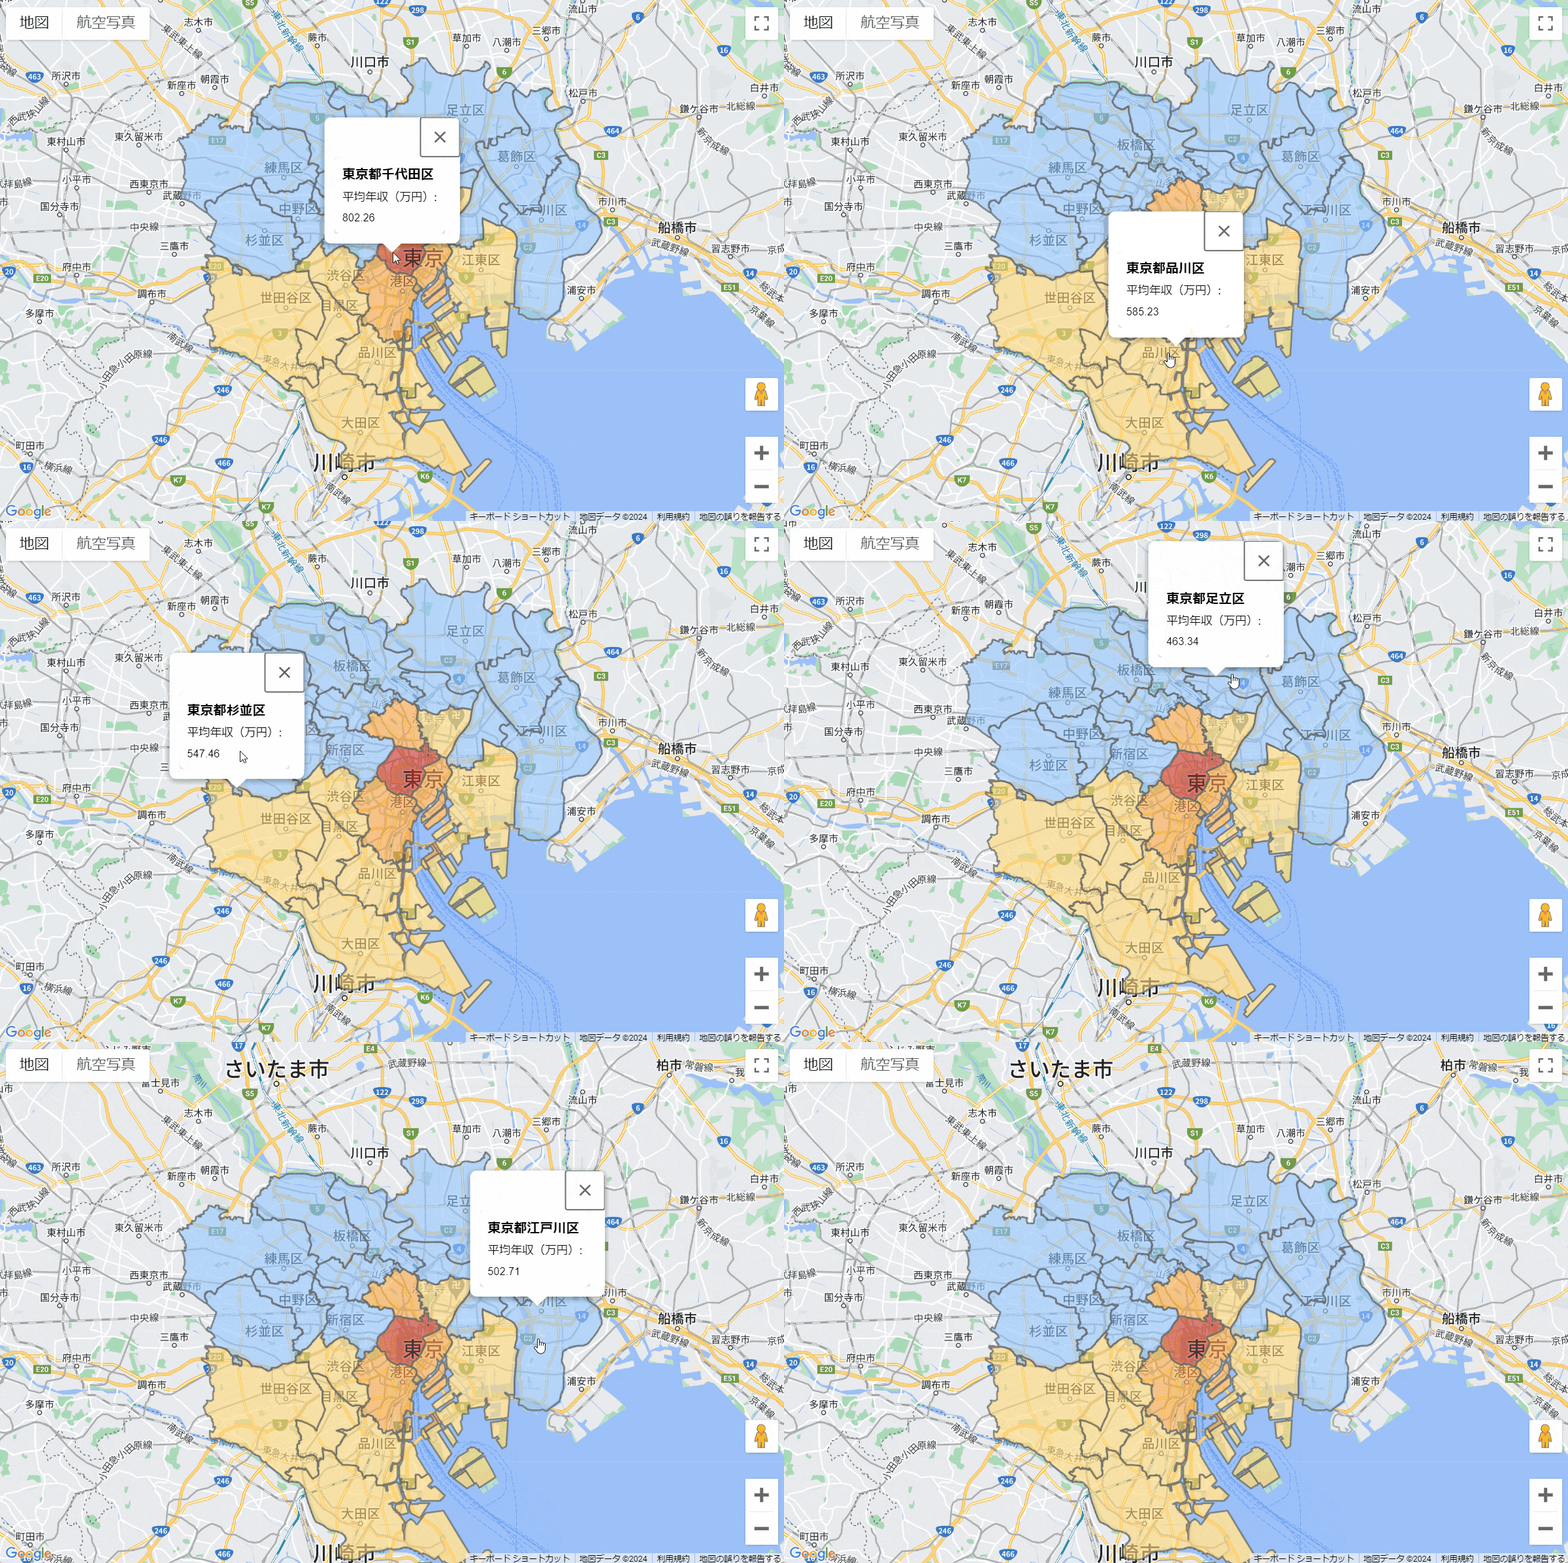
東京都23区の平均年収データを地図で見てみます
東京都23区の年収のデータをGoogle Mapで見てみようと思います。
東京都23区の年収データをGeoJSONで取得して、平均年収で色分けして表示しました。
年収データについて
この記事で取り扱う年収は世帯年収を指します。
以下で登場する行政界のポリゴンや年収のデータはマップマーケティングのTerraMap APIの行政界ポリゴンと年収別世帯数推計データを使用しました。
東京都23区の平均年収を見る
平均年収が高い区がより赤い色で表示するように色分けしています。そして年収の情報をGoogle MapのInfoWindow機能でマウスオーバー時に表示しています。
結果を見てみると、平均年収一番高いエリアは千代田区とその周辺の区で、千代田区中心に千代田区南の区が北の区より平均年収が高い結果になります。
コードについて
Maps JavaScript APIを使用します。
東京都23区(市区町村レベル)のポリゴン表示は以下の記事をベースにしました。
平均年収で色塗り分けするコード
450万円と750万円を境として、450万円から750万円は100万円刻みで色塗り分けしています。
// 平均年収に基づいて色を決定する関数
function getColor(value) {
    if (value <= 450) {
        return '#5b97ee'; // 濃い青
    } else if (value <= 550) {
        return '#92c7ff'; // 薄い青
    } else if (value <= 650) {
        return '#ffd976'; // 薄い黄色
    } else if (value <= 750) {
        return '#ffa746'; // 濃い黄色
    } else {
        return '#d7352b'; // 赤い
    }
}

const poly = new google.maps.Polygon({
    paths: paths,
    strokeColor: '#666',
    strokeOpacity: 0.8,
    strokeWeight: 2,
    fillColor: getColor(calculatedValue),
    fillOpacity: 0.6,
    map: map
});
JavaScript全体のサンプルコード
index.js
let map;
async function initMap() {
    const { Map } = await window.google.maps.importLibrary("maps");
    map = new Map(document.getElementById("map"), {
      center: { lat: 35.68437, lng: 139.75247 },
      zoom: 10,
    });

    // TerraMap APIからデータを取得する部分はJSONファイルを読み込んで疑似的に再現
    fetch('area.json')
        .then(response => response.json())
        .then(geoJsonData => {
            drawPolygons(geoJsonData);
        })
        .catch(error => console.error('Error fetching GeoJSON data:', error));
}

// 平均年収に基づいて色を決定する関数
function getColor(value) {
    if (value <= 450) {
        return '#5b97ee'; // 濃い青
    } else if (value <= 550) {
        return '#92c7ff'; // 薄い青
    } else if (value <= 650) {
        return '#ffd976'; // 薄い黄色
    } else if (value <= 750) {
        return '#ffa746'; // 濃い黄色
    } else {
        return '#d7352b'; // 赤い
    }
}

function drawPolygons(geoJsonData) {
    // GeoJSONデータからポリゴンを描画
    geoJsonData.features.forEach(feature => {
        const polygons = feature.geometry.coordinates;

        // 年収総額データ
        const nenshuSum = feature.properties.data.find(item => item.stat_item_id === 17969)?.value;
        // 年収階級別世帯合計データ
        const householdNumber = feature.properties.data.find(item => item.stat_item_id === 17955)?.value;
        // 平均年収を計算する
        const calculatedValue = nenshuSum && householdNumber ? (nenshuSum / householdNumber).toFixed(2) : "N/A";

        const wardName = feature.properties.points[0].join("");
        const infoWindowContent = `
            <div class="custom-info-window">
                <h3>${wardName}</h3>
                <p>平均年収(万円):</p>
                <ul class="value-list">${calculatedValue}</ul>
            </div>
        `;
        const infoWindow = new google.maps.InfoWindow();

        polygons.forEach(polygon => {
            const paths = polygon[0].map(coord => ({ lat: coord[1], lng: coord[0] }));

            const poly = new google.maps.Polygon({
                paths: paths,
                strokeColor: '#666',
                strokeOpacity: 0.8,
                strokeWeight: 2,
                fillColor: getColor(calculatedValue),
                fillOpacity: 0.6,
                map: map
            });

            // ポリゴンにマウスオーバーイベントを追加
            poly.addListener('mouseover', (event) => {
                infoWindow.setContent(infoWindowContent);
                infoWindow.setPosition(event.latLng);
                infoWindow.open(map);
            });

            // ポリゴンからマウスが離れたときにインフォウィンドウを閉じる
            poly.addListener('mouseout', () => {
                infoWindow.close();
            });
        });
    });
}

initMap();
index.jsコードで使用したJSONファイルの抜粋は以下になります。
area.json
{
    "type": "FeatureCollection",
    "features": [
        {
            "type": "Feature",
            "properties": {
                "area": {
                    "area": 11.397688758847336,
                    "ratio_area": [
                        11.397688758847336
                    ],
                    "ratio": [
                        1.0
                    ]
                },
                "data": [
                    {
                        "is_authorized": true,
                        "ratio_value": [
                            "33993"
                        ],
                        "stat_item_id": 17955,
                        "stat_id": "007002000",
                        "value": "33993"
                    },
                    {
                        "is_authorized": true,
                        "ratio_value": [
                            "27271300"
                        ],
                        "stat_item_id": 17969,
                        "stat_id": "007002000",
                        "value": "27271300"
                    }
                ],
                "point_coordinates": [
                    139.75019,
                    35.68687
                ],
                "geocode": "13101",
                "points": [
                    [
                        "千代田区"
                    ]
                ]
            },
            "geometry": {
                "type": "MultiPolygon",
                "coordinates": [
                    [
                        [
                            [
                                139.748974398,
                                35.670568286
                            ],
年収マップ関連情報
最後に、弊社で公開している関連記事や年収マップの紹介です。
- 全国の年収データ

