目的
ggplotを用いて作った図を複数並べる時、凡例の扱いで悩むことが何回かあったので、メモがわりに書き残しておきます。
今回想定しているのは以下のようなケースです。
- ggplotを用いて複数の図を並べたい
- 共通するタイプの凡例を持つ
-
facet_gridやfacet_wrapを使えない事情がある(プロットするデータセットが大きすぎるとか、別々のオブジェクトとしてRDataに保存しているとか)
データセット
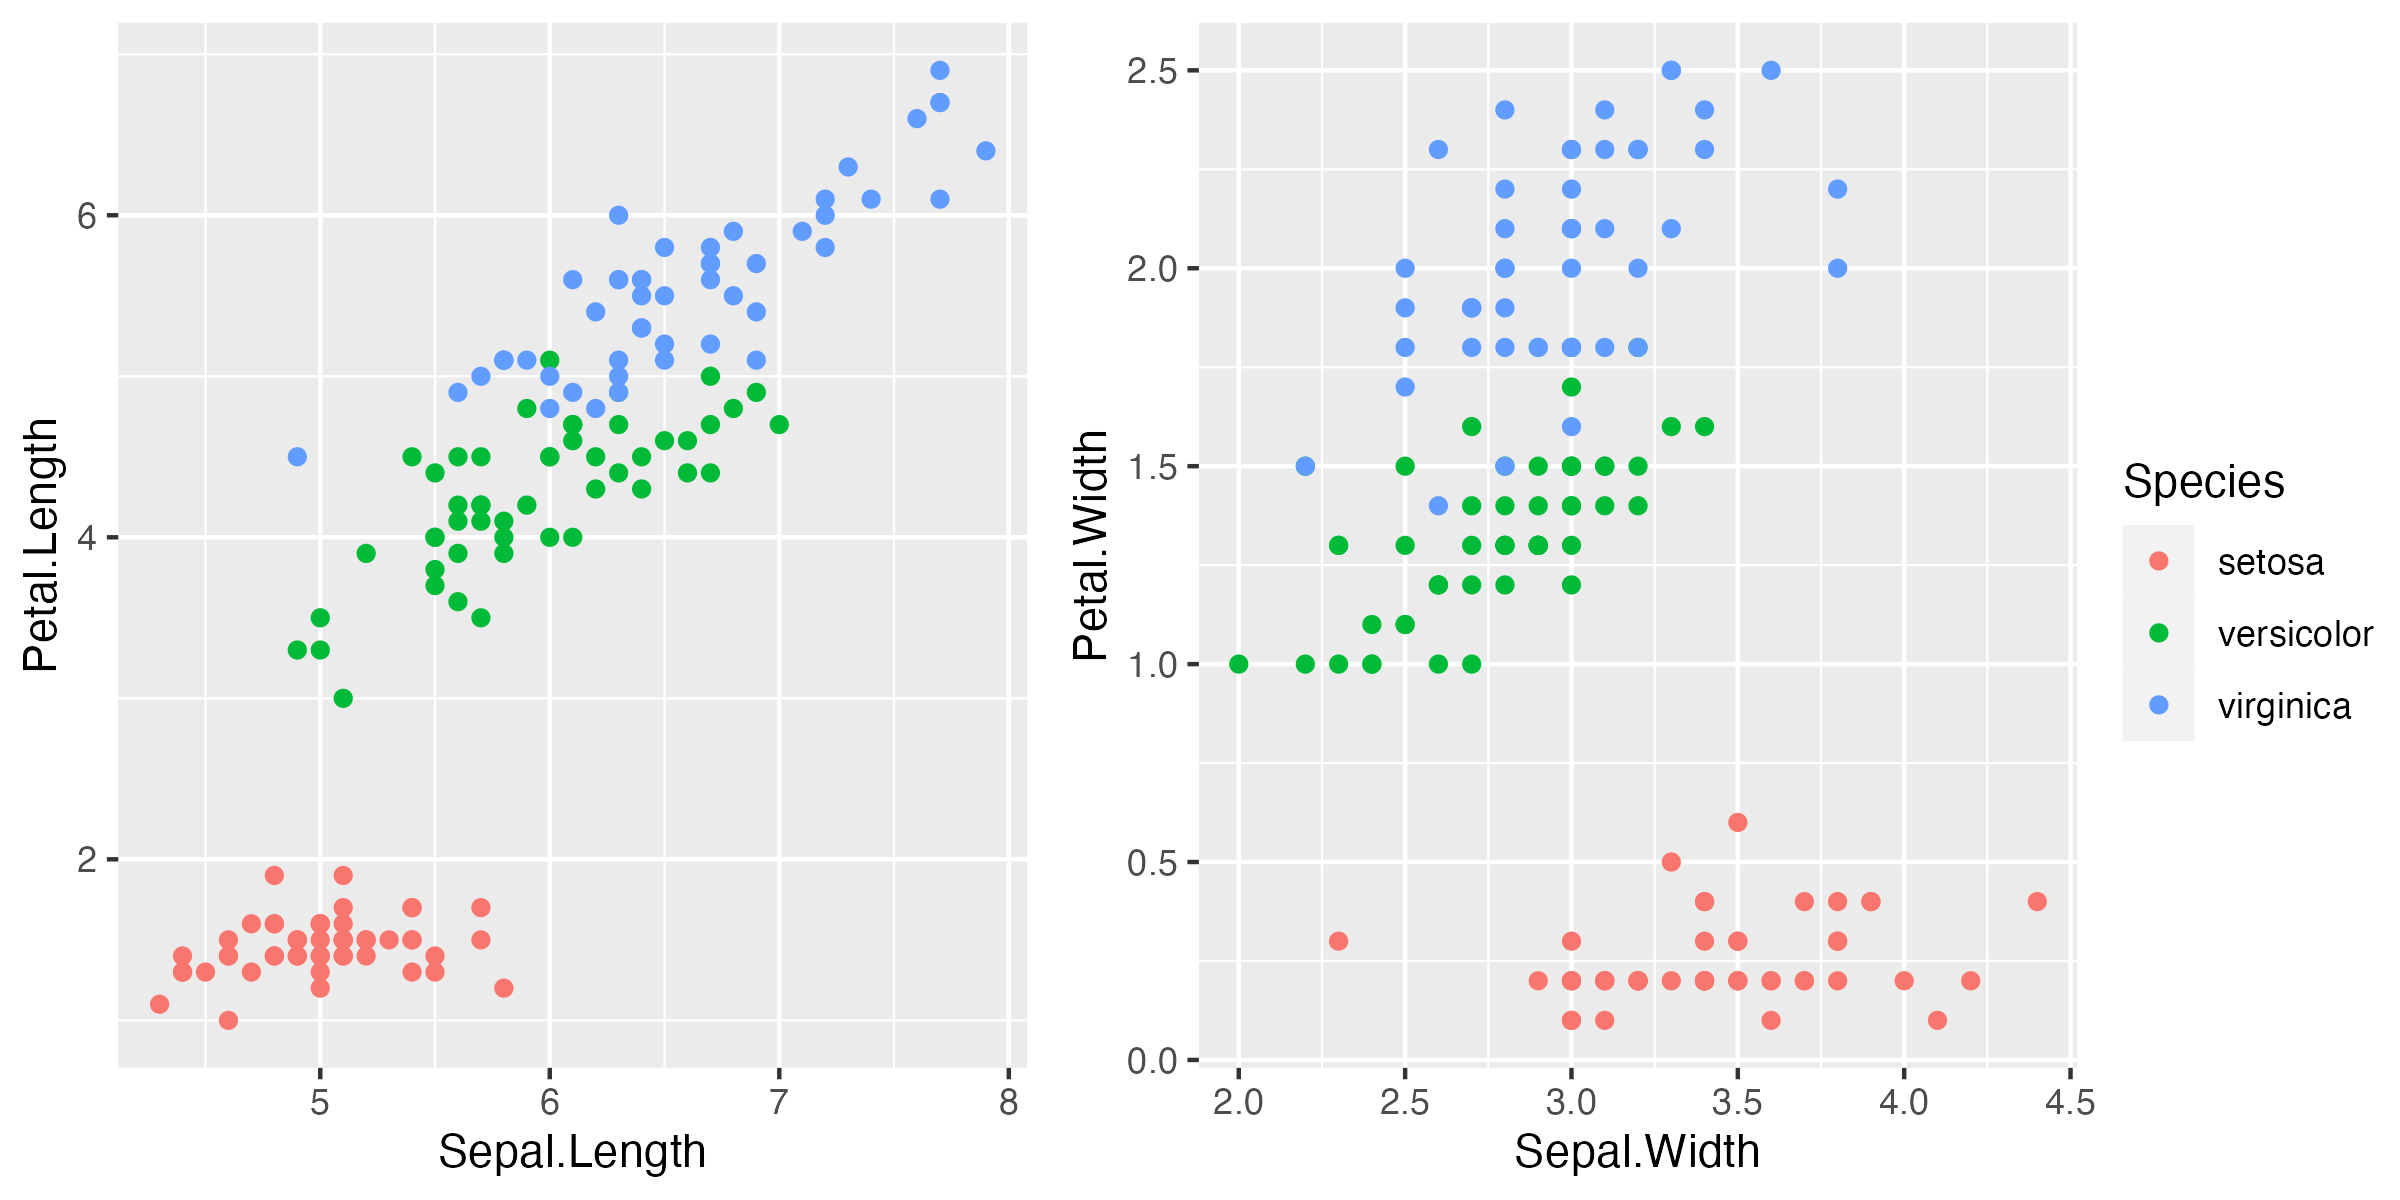
例として、irisデータセットのこんなプロットを2つ並べます。
pacman::p_load(tidyverse, ggpubr, lemon, patchwork)

data(iris)
g1 <- iris %>%
  ggplot() +
  geom_point(
    aes(x = Sepal.Length, y = Petal.Length, color = Species)
  )

g2 <- iris %>%
  ggplot() +
  geom_point(
    aes(x = Sepal.Width, y = Petal.Width, color = Species)
  )
1. ggpubr
ggpubrパッケージ内のggarrange関数をcommon.legend = TRUEとすることで共通の判例を指定できます。
example_ggpubr <- ggpubr::ggarrange(
  g1, g2, ncol = 2, common.legend = TRUE, legend = "right"
)
ggsave(example_ggpubr, file = "example_ggpubr.png", height = 4, width = 8)
2. gridExtra
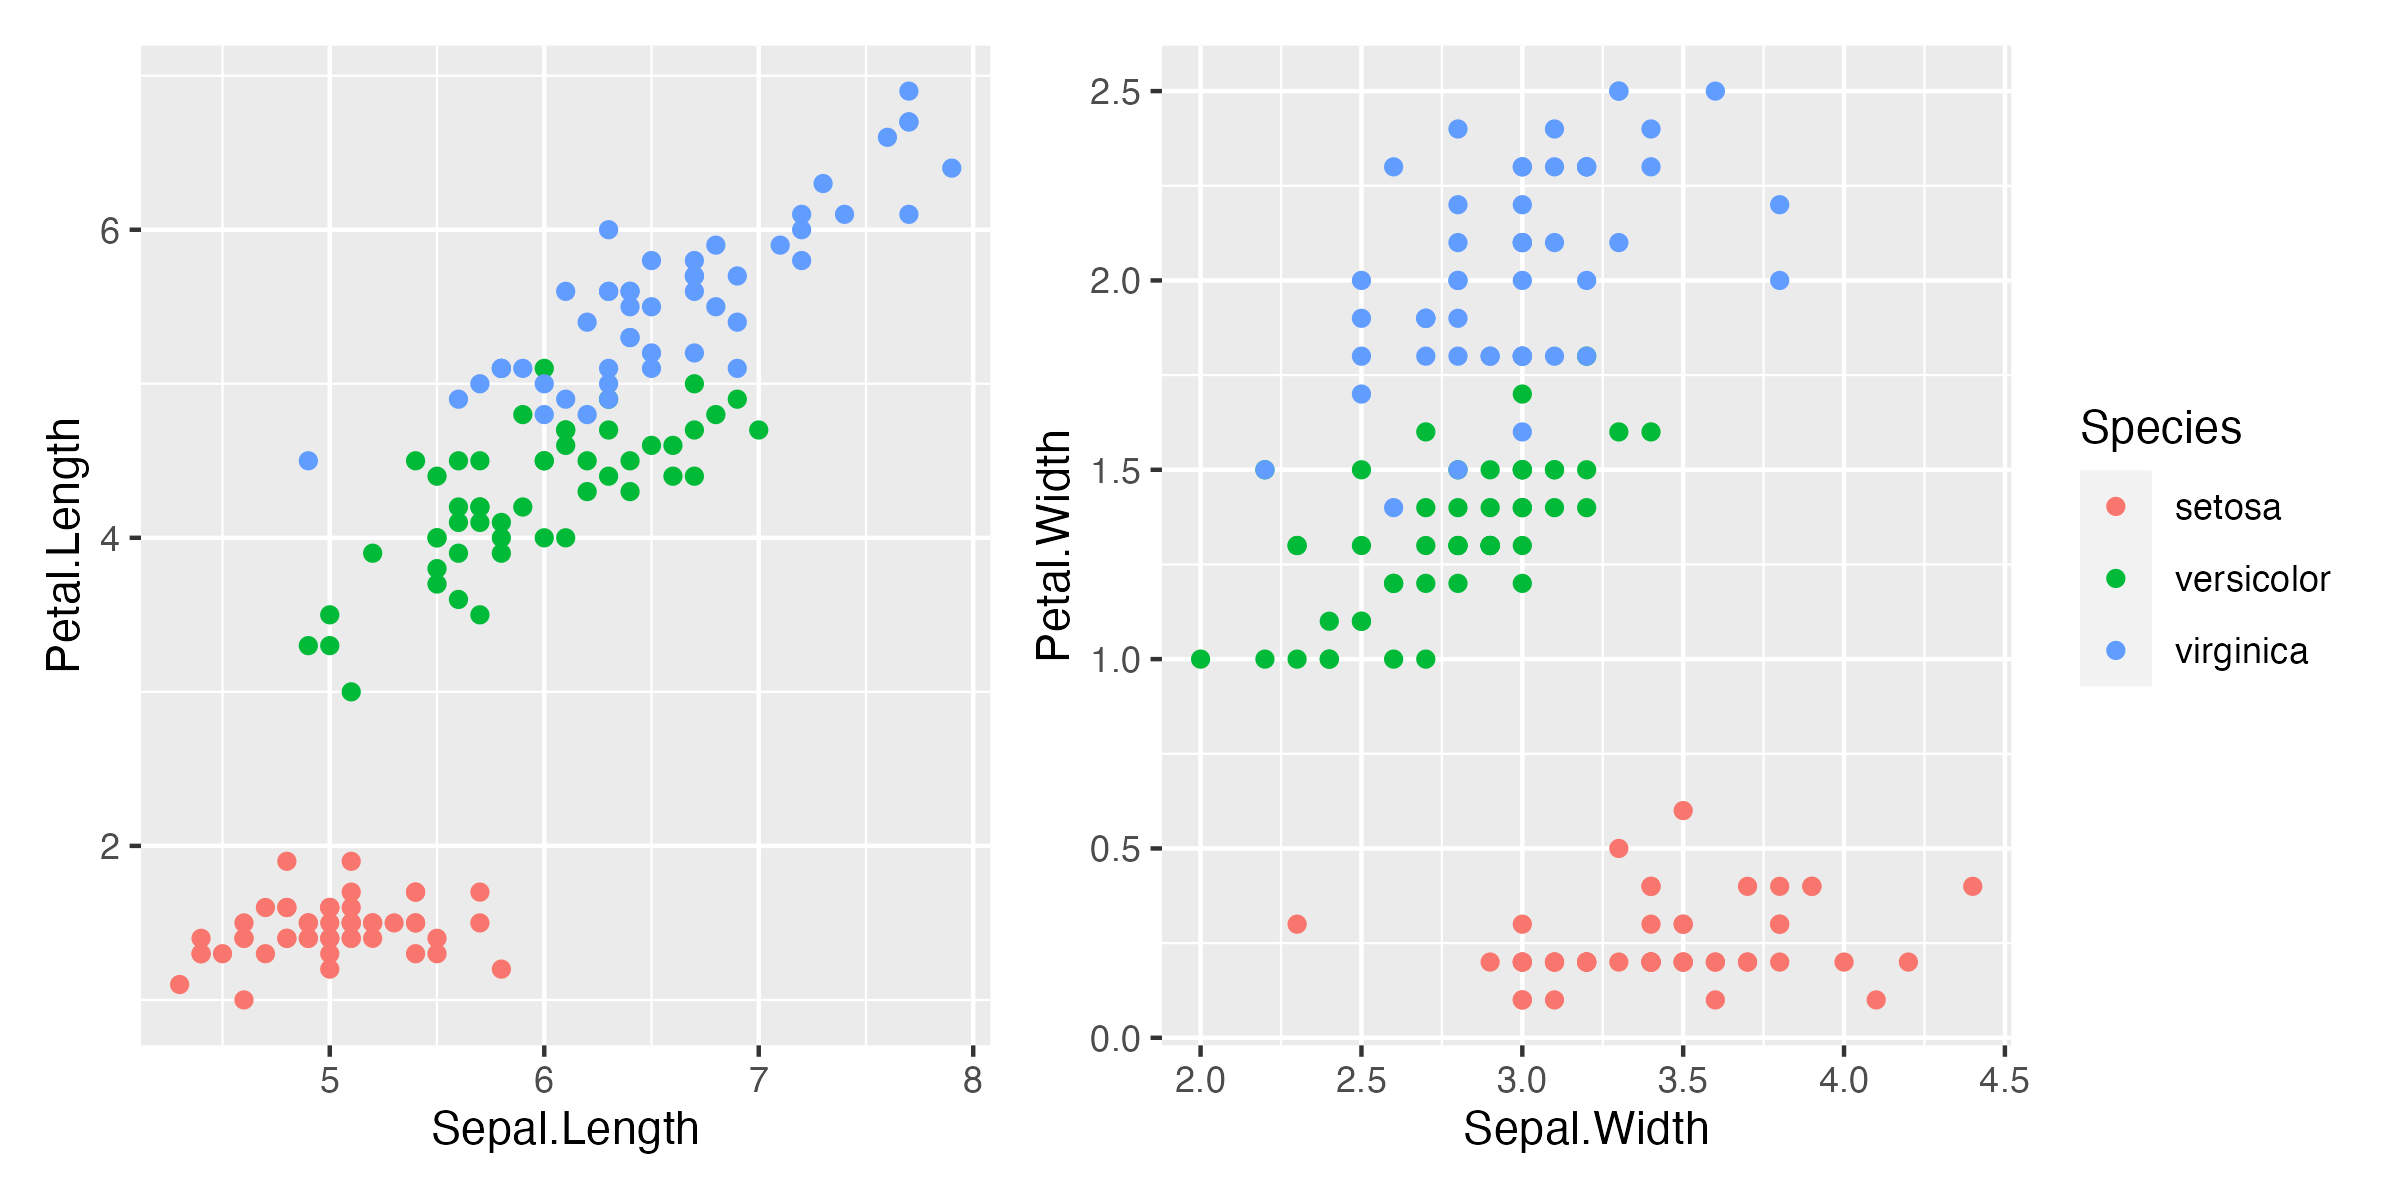
lemonパッケージ内のgrid_arrange_shared_legend関数を用いても共通の凡例を設定できます。
example_lemon <- lemon::grid_arrange_shared_legend(
  g1, g2, ncol = 2, position = "right"
)
ggsave(example_lemon, file = "example_lemon.png", height = 4, width = 8)
1.とほぼ同じ図が表示されるので結果は割愛します。
lemonパッケージは他にもfacet_系のプロットの扱いなどに便利な関数群があつまったパッケージのような印象があります。
3. patchwork
patchworkパッケージは公式ホームページでも
The goal of patchwork is to make it ridiculously simple to combine separate ggplots into the same graphic.
と言っている通り、ggplotで作成したプロットを並べるのに特化したパッケージであり、実際、シンプルな記法とかなり自由度の高いレイアウトが可能なパッケージだと思います。
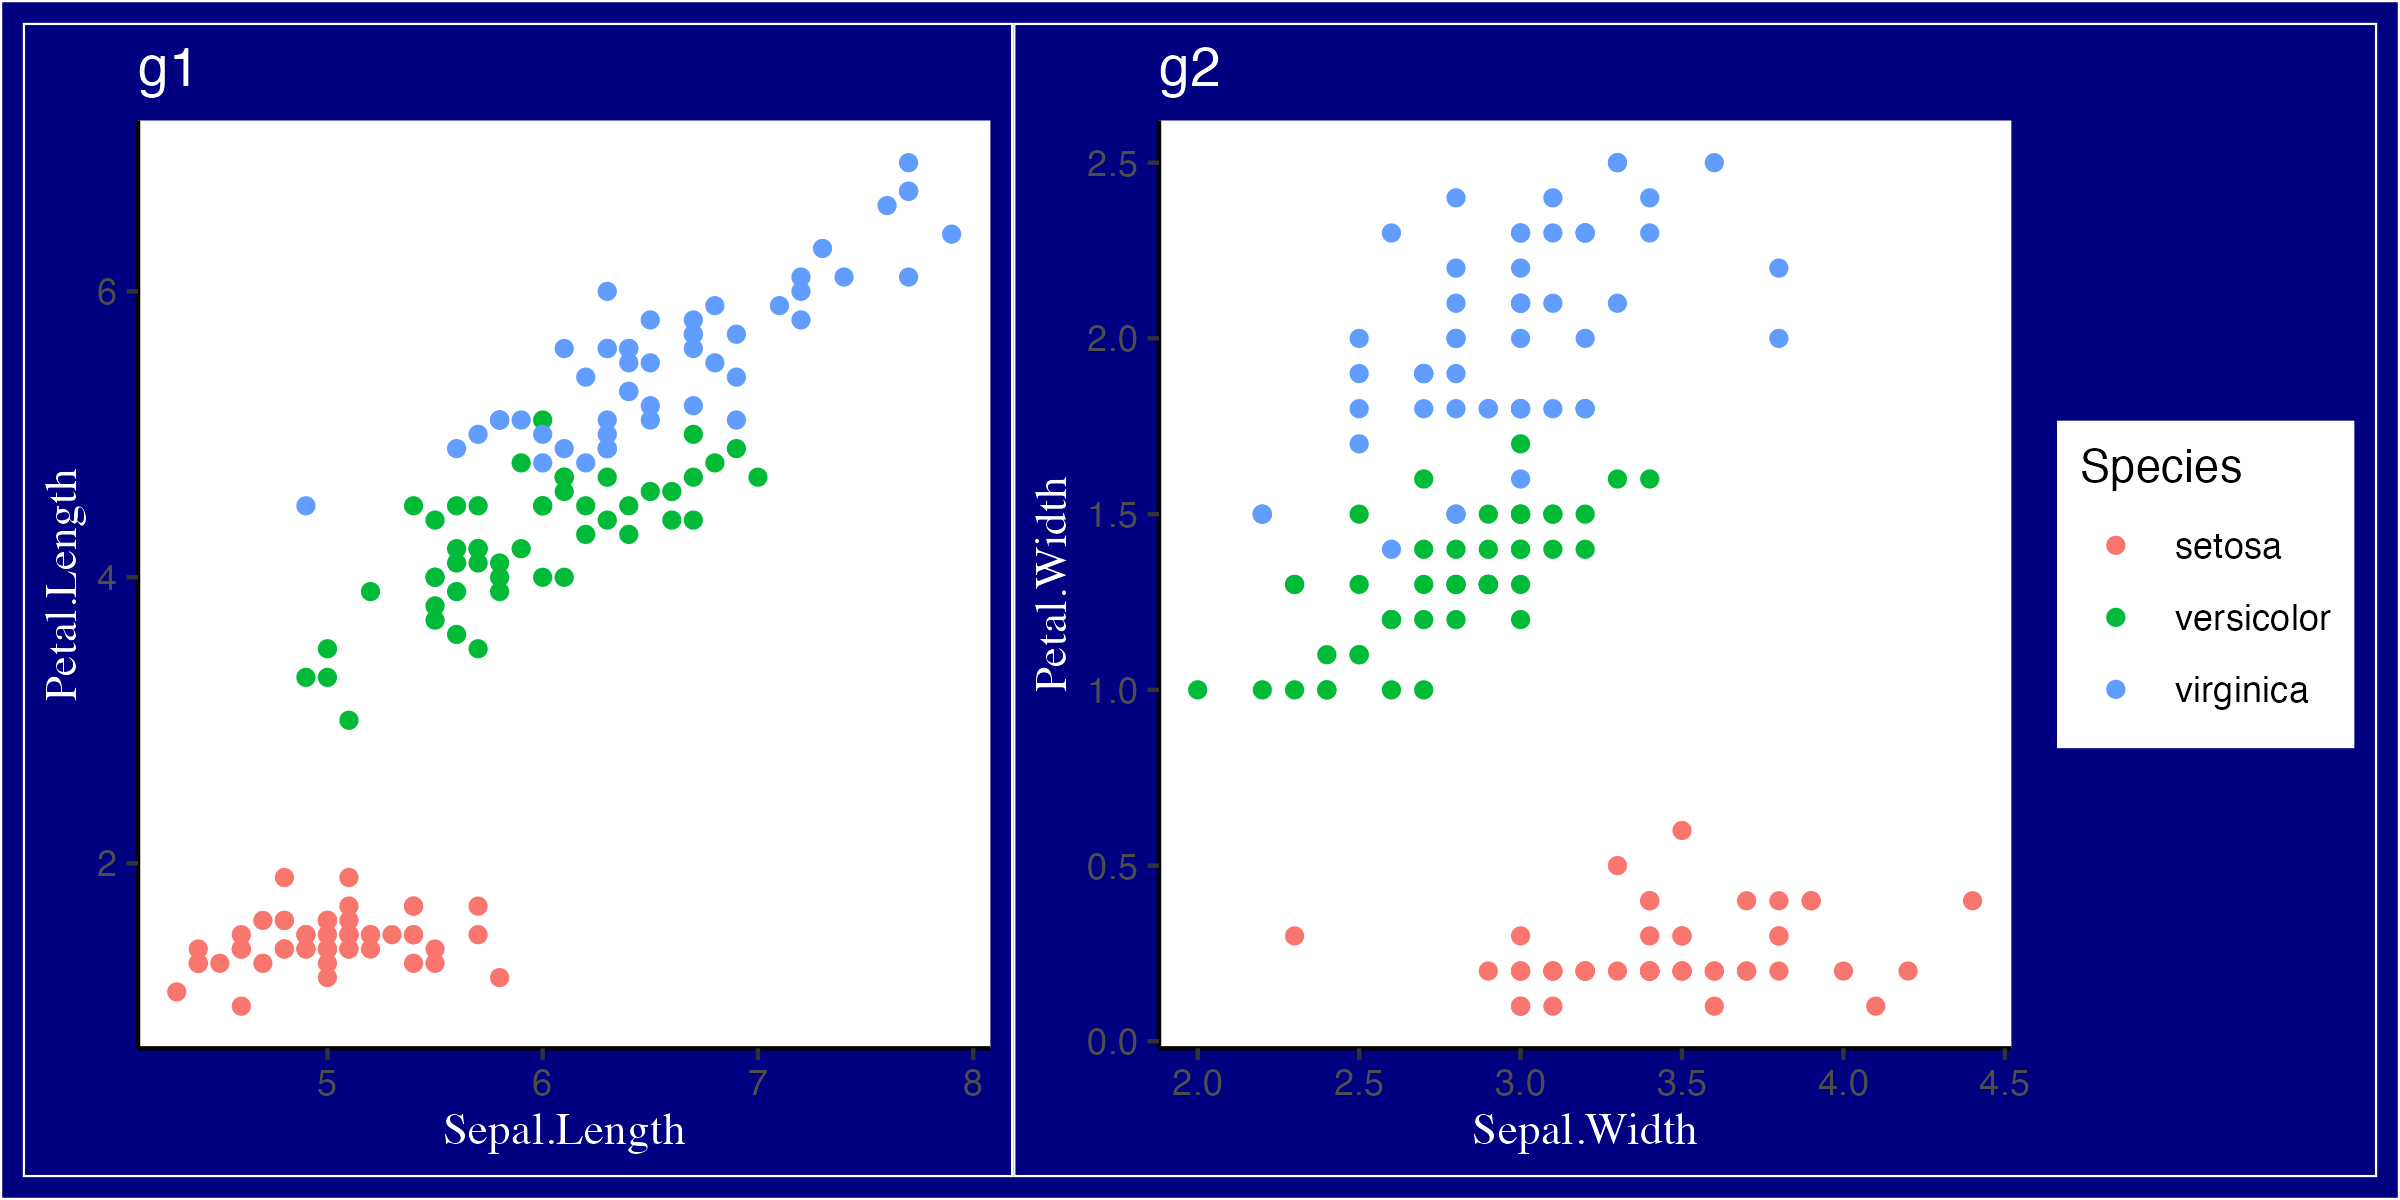
+演算子とplot_layout関数を使うことで、
example_patchwork <- g1 + g2 + plot_layout(guides = "collect")
と、目的のプロットを得ることができます。
また、&演算子を使うことで、複数のパネルに対して同時に体裁の変更などを適用することができます。
g1 <- g1 + ggtitle("g1")
g2 <- g2 + ggtitle("g2")

example_patchwork <- g1 + g2 +
  plot_layout(guides = "collect") &
  theme_classic() &
  theme(
    axis.title.x = element_text(family = "serif", color = "white"),
    axis.title.y = element_text(family = "serif", color = "white"),
    plot.background = element_rect(fill = "navy"),
    plot.title = element_text(color = "white")
  )
ggsave(example_patchwork, file = "example_patchwork.png", height = 4, width = 8)
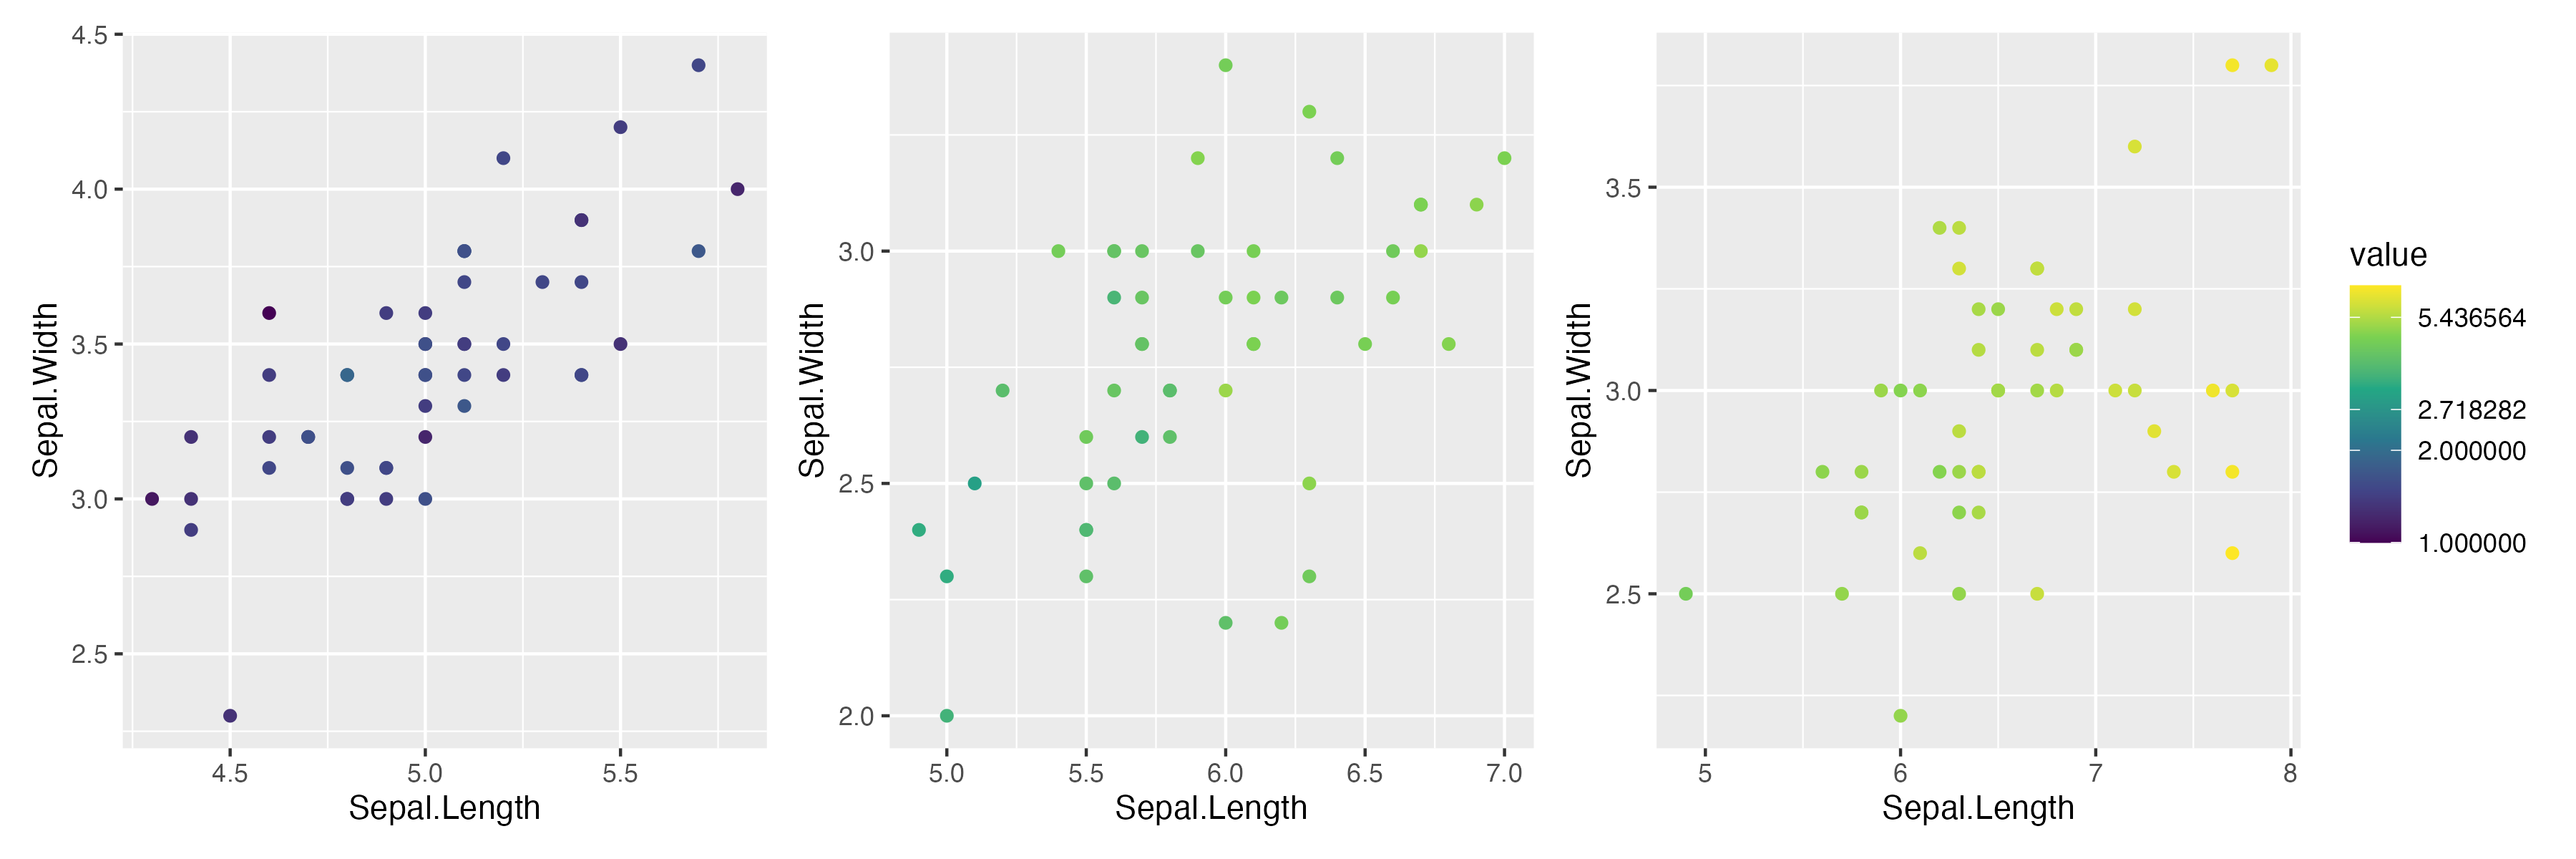
さらに、以下のような連続値に関する凡例を持つプロットを並べる時には、
g3 <- iris %>%
  filter(Species == "setosa") %>%
  ggplot() +
  geom_point(
    aes(x = Sepal.Length, y = Sepal.Width, color = Petal.Length)
  )

g4 <- iris %>%
  filter(Species == "versicolor") %>%
  ggplot() +
  geom_point(
    aes(x = Sepal.Length, y = Sepal.Width, color = Petal.Length)
  )

g5 <- iris %>%
  filter(Species == "virginica") %>%
  ggplot() +
  geom_point(
    aes(x = Sepal.Length, y = Sepal.Width, color = Petal.Length)
  )

example_345 <- g3 + g4 + g5
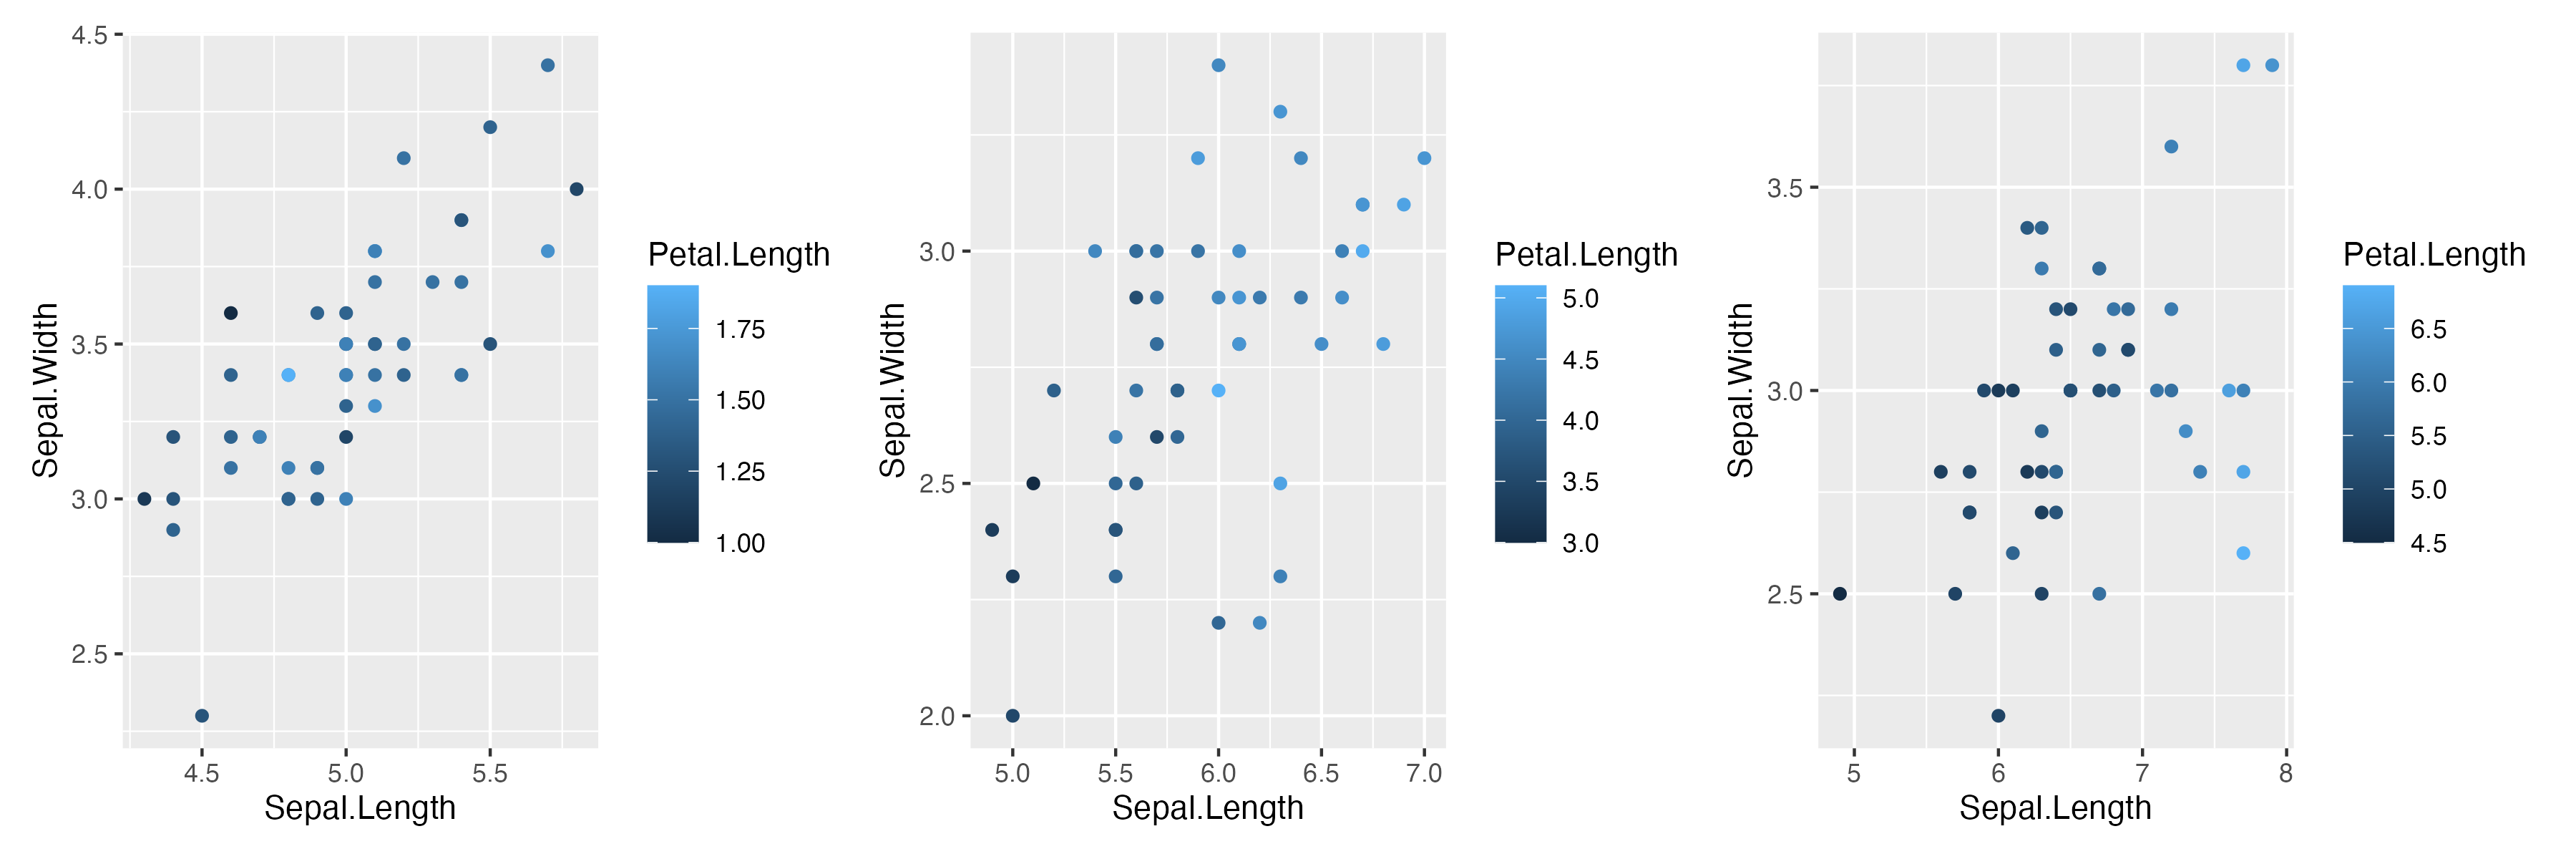
以下のように、カラーパレットの中でlimit引数に値の範囲を指定することで、お好きなカラーパレットのお好きな範囲の中で凡例を作成することができます。もちろんtrans = "log"を用いた対数変換なども可能です。
example_345 <- example_345 +
  plot_layout(guides = "collect") &
  scale_color_viridis_c(
    name = "value",
    trans = "log",
    limits = range(iris$Petal.Length)
  )
ggsave(example_345, file = "example_345.png", height = 4, width = 12)
複数のggplotを並べたりまとめて編集したりする時には、個人的にはpatchworkが一番取り回しがいいのかなと感じています。