iOS18でのアップデート
以下のスライドにまとめた

これは何?
Swift Chartsのドキュメントを上から下まで読んである程度自分なりにまとめたものになります。なのでこの記事を読んでChartsを知ろうというよりは、実装するときの参考資料程度に見た方がいいかと思います。
もちろんドキュメントの内容全てを網羅してる訳でもないので、随時更新しようと思います。
注意事項
本記事に記載しているAPIなどについては、X軸用/Y軸用とそれぞれあります。
全て書くと冗長になるので、X軸のAPIについて記載がある場合は、Y軸のAPIもあるんだなと思いながら見てください。
基礎
日本語ではグラフのことを「グラフ」というが、Charts内ではグラフのことをチャートという。
棒グラフは”bar chart”、折れ線グラフは”line chart”といった感じ。
また、以下のような用語がある

- Mark
- データポイントを示す1つ1つの視覚的な形状のこと。下の図の青い棒1つをMarkという
- Plot area
- chartの描画領域
- Grid line
- chartの背景に表示される線
- Axis
- グラフの縦軸横軸を示す
- Axis value label (tick label)
- 軸に沿って配置される数値やカテゴリーのLabel
- Tick
- Grid lineの延長上に表示されるもので、Axis value labelの正確な位置を示すもの
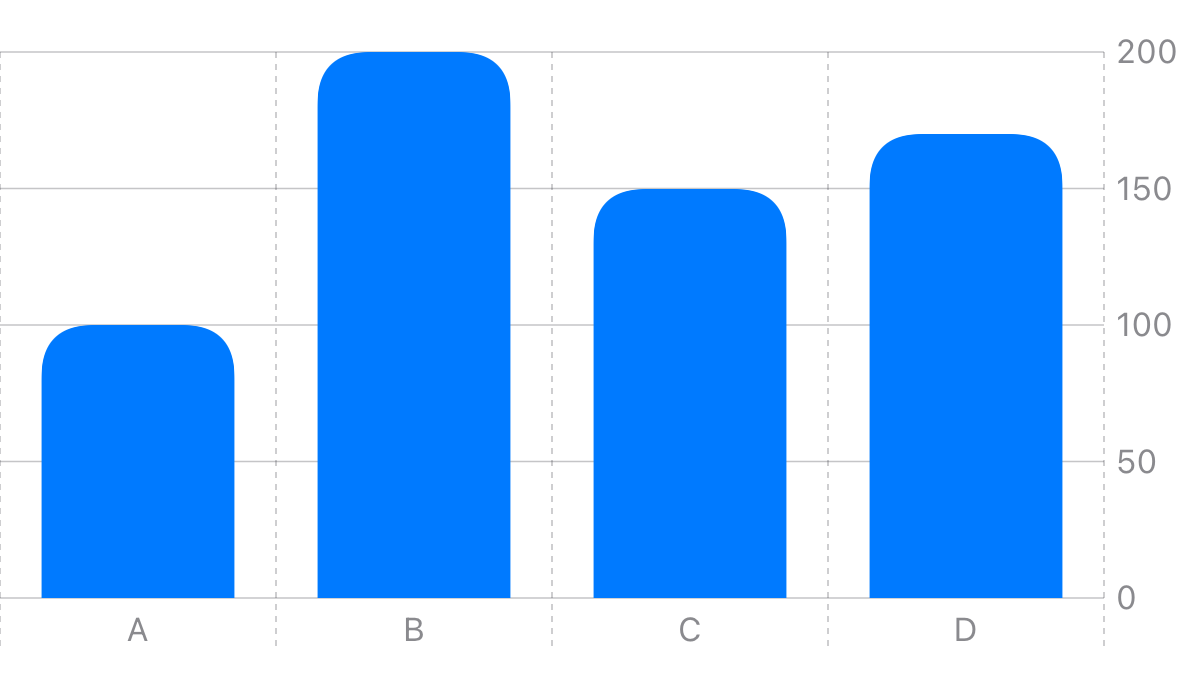
基本的な定義方法
Chart内に描画したいMarkを定義するだけ。
import SwiftUI
import Charts

struct ContentView: View {
    var body: some View {
        Chart {
            BarMark(
                x: .value("Category", "A"),
                y: .value("value", 100)
            )
            BarMark(
                x: .value("Category", "B"),
                y: .value("value", 200)
            )
        }
        .frame(height: 200)
        .padding()
    }
}

BarMarkの引数x, yにそれぞれ表示するカテゴリとその値を指定する。
各軸の情報は指定しなくてもデータに基づいて最適な情報を描画してくれる。
ForEachの使用
実際には1つ1つBarMark()を指定しないので、以下のようにまとめて定義する
struct Data: Identifiable {
    var id: String { category }
    let category: String
    let value: Int
}

struct ContentView: View {

    let data: [Data] = [
        .init(category: "A", value: 100),
        .init(category: "B", value: 200)
    ]

    var body: some View {
        Chart {
            ForEach(data) {
                BarMark(
                    x: .value("Category", $0.category),
                    y: .value("value", $0.value)
                )
            }
        }
    }
}
Chart内で扱うのがForEachのデータのみの場合、以下のように指定も可能。
Chart(data) {
    BarMark(
        x: .value("Category", $0.category),
        y: .value("value", $0.value)
    )
}
// dataがidentifiableに準拠してない場合Chart(data, id: \.category)のように指定も可能
グラフの向きを変える
xとyの値を入れ替えると描画も横向きに変わる
BarMark(
    x: .value("value", $0.value),
    y: .value("Category", $0.category)
)

Markの種類
以下のMarkを通して各chartを実装できる。これに加えてiOS17からはSectorMark(いわゆる円グラフ)が実装可能になった。

複雑なchartもこのMarkを組み合わせて実装する。
BarMark
基本は前述した通りのBarMark(x:y:)。これ以外にもイニシャライザとその引数によって様々なBarMarkが表現できる
BarMark(
    x: .value("Category", $0.category),
    y: .value("value", $0.value)
)
BarMarkのイニシャライザ1
BarMark(x:y:)のイニシャライザをよく見ると、デフォルト引数として以下のような指定も可能となっている。
(MarkDimension、MarkStackingMethodについては後述)
init<X, Y>(
    x: PlottableValue<X>, // x軸の値
    y: PlottableValue<Y>, // y軸の値
    width: MarkDimension = .automatic, // Markの横幅
    height: MarkDimension = .automatic, // Markの縦幅
    stacking: MarkStackingMethod = .standard // stackの方法
) where X : Plottable, Y : Plottable
例えば以下のような表現も可能となる
BarMark(
    x: .value("Category", $0.category),
    y: .value("value", $0.value),
    width: .fixed(30), // 横幅を30に固定
    stacking: .center // 各Markの中心点が中央に来るように
)

BarMarkのイニシャライザ2
range bar chart(範囲型棒グラフ)を生成するのに使用する
init<X, Y>(
    x: PlottableValue<X>,// x軸の値
    yStart: PlottableValue<Y>, // そのMarkのminの値
    yEnd: PlottableValue<Y>, // そのMarkのmaxの値
    width: MarkDimension = .automatic // Markの横幅
) where X : Plottable, Y : Plottable
Chart(data, id: \.date) {
    BarMark(
        x: .value("Month", $0.date, unit: .month),
        yStart: .value("Daily Min", $0.dailyMin),
        yEnd: .value("Daily Max", $0.dailyMax),
        width: .init(floatLiteral: 20)
    )
}

BarMarkのイニシャライザ3
x軸かy軸を固定したchartを生成する。
iPhoneの設定アプリで見れるstorageの表現などに使用。
init<X>(
    x: PlottableValue<X>,
    yStart: CGFloat? = nil, // その値の開始位置。nilの場合は左に揃える
    yEnd: CGFloat? = nil, // その値の終了位置
    width: MarkDimension = .automatic,// Markの横幅
    stacking: MarkStackingMethod = .standard // stackの方法
) where X : Plottable
let data: [FileCategory] = [
    .init(fileSizePercent: 50, fileCategory: "Applications"),
    .init(fileSizePercent: 10, fileCategory: "Photos"),
    .init(fileSizePercent: 5, fileCategory: "Music"),
    .init(fileSizePercent: 3, fileCategory: "Podcasts"),
    .init(fileSizePercent: 10, fileCategory: "iOS"),
    .init(fileSizePercent: 10, fileCategory: "System Data"),
]

public var body: some View {
    VStack {
        Chart(data, id: \.fileCategory) {
            BarMark(
                x: .value("File Size Percent", $0.fileSizePercent)
            )
            .foregroundStyle(by: .value("File Category",$0.fileCategory))
        }
        .chartXAxis(.hidden) // x軸を非表示
        .frame(height: 50)
    }
}
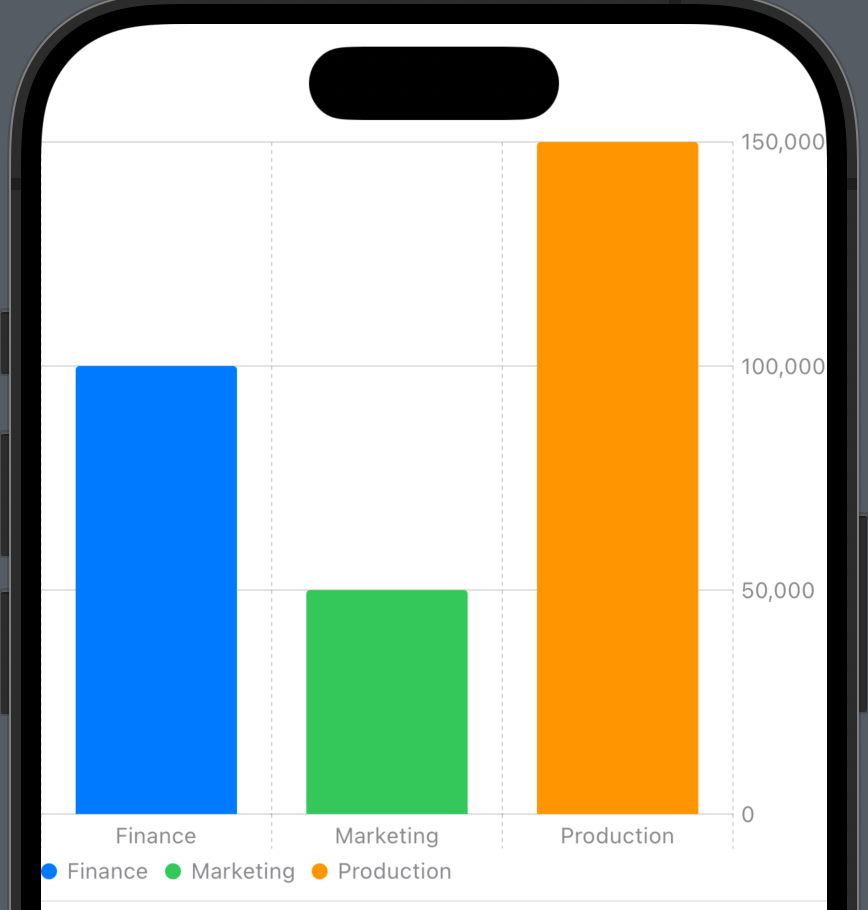
.foregroundStyle(by:)を用いることでグループごとに色を変えることができる。
自動的にlegend(凡例)も付与される。

BarMarkのイニシャライザ4
Y軸固定で、Xの指定した開始位置/終了位置で描画する(X軸固定のイニシャライザもあり)
init<X>(
    xStart: PlottableValue<X>,
    xEnd: PlottableValue<X>,
    yStart: CGFloat? = nil,
    yEnd: CGFloat? = nil
) where X : Plottable
let tasksData: [WorkHours] = [
    WorkHours(task: "Task A", startHour: 9, endHour: 13),
    WorkHours(task: "Task B", startHour: 14, endHour: 16),
    WorkHours(task: "Task C", startHour: 17, endHour: 19),
]

public var body: some View {
    Chart(tasksData, id: \.task) {
        BarMark(
            xStart: .value("Start Time", $0.startHour),
            xEnd: .value("End Time", $0.endHour)
        )
    }
    .frame(height: 50)
}

積み上げ棒グラフ
.foregroundStyle(by:)を使うことでシンプルなStacked Bar Chartを作れる。
struct DataSummary: Identifiable {
    var id: String { name }
    var name: String
    var dataList: [Data]
}

struct Data: Identifiable {
    var id: String { category }
    let category: String
    let value: Int
}

struct ContentView: View {
    let hogeDataList: [Data] = [
        .init(category: "A", value: 100),
        .init(category: "B", value: 200)
    ]
    let piyoDataList: [Data] = [
        .init(category: "A", value: 50),
        .init(category: "B", value: 80)
    ]

    var dataSummaryList: [DataSummary] {[
        .init(name: "hoge", dataList: hogeDataList),
        .init(name: "piyo", dataList: piyoDataList)
    ]}

    var body: some View {
        Chart(dataSummaryList) { dataSummary in
            ForEach(dataSummary.dataList) { data in
                BarMark(
                    x: .value("Category", data.category),
                    y: .value("value", data.value)
                )
                // nameごとに色を変える(ここでは色の指定ができない)
                .foregroundStyle(by: .value("name", dataSummary.name))
            }
        }
        // 色の指定をする
        .chartForegroundStyleScale([
             "hoge": .green, "piyo": .red
         ])
    }
}

グループ化された棒グラフ
.positionを用いることでグループ化したchartを作れる
BarMark(
    x: .value("Category", data.category),
    y: .value("value", data.value)
)
.foregroundStyle(by: .value("name", dataSummary.name))
// nameごとにグループ化したchartを作る
.position(by: .value("name", dataSummary.name))

LineMark
折れ線グラフを描画するのに使用
Chart(hogeDataList) {
	LineMark(
        x: .value("Category", $0.category),
        y: .value("value", $0.value)
	)
}

LineMarkのイニシャライザ
複数のデータを扱う場合、以下のようにseries引数を用いることで区別できる。これを指定しない場合、線がつながってしまうので注意。
Chart(dataSummaryList) { dataSummary in
    ForEach(dataSummary.dataList) { data in
        LineMark(
            x: .value("Category", data.category),
            y: .value("value", data.value),
            series: .value("name", dataSummary.name) // データの区別
        )
    }
}

series引数を使わなくても.foregroundStyleを使うことで分けることは可能。
LineMark(
    x: .value("Category", data.category),
    y: .value("value", data.value)
)
.foregroundStyle(by: .value("name", dataSummary.name))

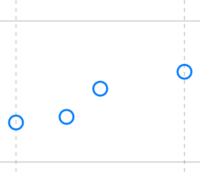
PointMark
散布図に使ったり、他のMarkと組み合わせて使うことが多そう
Chart(hogeDataList) {
    PointMark(
        x: .value("Category", $0.category),
        y: .value("value", $0.value)
    )
}

LineMarkとPointMarkの組み合わせ
LineMarkと組み合わせる場合、以下のように書くことも可能だが、
Chart(hogeDataList) {
    LineMark(
        x: .value("Category", $0.category),
        y: .value("value", $0.value)
    )
    PointMark(
        x: .value("Category", $0.category),
        y: .value("value", $0.value)
    )
}

折れ線でPointを表示したい場合は.symbolのみで表示することも可能
LineMark(
    x: .value("Category", $0.category),
    y: .value("value", $0.value)
)
.symbol(.circle)
PointMarkの別のイニシャライザ
init<X>(
    x: PlottableValue<X>, // x軸の値
    y: CGFloat? = nil  // yの位置。
) where X : Plottable
Chart(hogeDataList) {
    PointMark(
        x: .value("value", $0.value)
    )
}
.frame(height: 100)

AreaMark
面グラフを作れる
let cheeseburgerCostByItem: [Food] = [
    .init(name: "Burger", price: 0.07, year: 1960),
    .init(name: "Cheese", price: 0.03, year: 1960),
    .init(name: "Bun", price: 0.05, year: 1960),
    .init(name: "Burger", price: 0.10, year: 1970),
    ...
]
...

Chart(cheeseburgerCost) {
    AreaMark(
        x: .value("Date", $0.date),
        y: .value("Price", $0.price)
    )
}

foregroundStyleを使って積み上げ面グラフを作ったりも可能
Chart(cheeseburgerCostByItem) {
    AreaMark(
        x: .value("Date", $0.date),
        y: .value("Price", $0.price)
    )
    .foregroundStyle(by: .value("Food Item", $0.name))
}

AreaMarkのイニシャライザ1
イニシャライザを見ると他にも引数がある
init<X, Y, S>(
    x: PlottableValue<X>,
    y: PlottableValue<Y>,
    series: PlottableValue<S>, // データの区別
    stacking: MarkStackingMethod = .standard // stackの方法
) where X : Plottable, Y : Plottable, S : Plottable
正規化した面グラフも作れる
Chart(cheeseburgerCostByItem) {
    AreaMark(
        x: .value("Date", $0.date),
        y: .value("Price", $0.price),
        stacking: .normalized // 正規化
    )
    .foregroundStyle(by: .value("Food Item", $0.name))
}

AreaMarkのイニシャライザ2
Y軸の開始位置と終了位置を指定したグラフを作れる
init<X, Y>(
    x: PlottableValue<X>,
    yStart: PlottableValue<Y>, // y軸での面の開始位置
    yEnd: PlottableValue<Y> // y軸での面の終了位置
) where X : Plottable, Y : Plottable
let data: [Weather] = [
    .init(month: 1, maximumTemperature: 10, minimumTemperature: 0),
    .init(month: 2, maximumTemperature: 12, minimumTemperature: 1),
    .init(month: 3, maximumTemperature: 15, minimumTemperature: 6),
    ...
]
...
Chart(data) {
    AreaMark(
        x: .value("Date", $0.date),
        yStart: .value("Minimum Temperature", $0.minimumTemperature),
        yEnd: .value("Maximum", $0.maximumTemperature)
    )
}

RuleMark
水平、垂直の罫線を使用してデータを表す
RuleMarkのイニシャライザ1
init<X>(
    x: PlottableValue<X>, // X軸上の罫線の表示位置
    yStart: CGFloat? = nil, // 罫線の開始位置
    yEnd: CGFloat? = nil // 罫線の終了位置
) where X : Plottable
Chart(sales) {
    BarMark(
        x: .value("Profit", $0.profit),
        y: .value("Department", $0.department)
    )
    RuleMark(x: .value("average", 100000))
        .foregroundStyle(.red)
}

yStart, yEndも入れると長さを調整できる↓
RuleMark(x: .value("average", 100000), yStart: 100, yEnd: 300)

RuleMarkのイニシャライザ2
init<X, Y>(
    x: PlottableValue<X>, // X軸上の罫線の表示位置
    yStart: PlottableValue<Y>, // 罫線の開始位置
    yEnd: PlottableValue<Y> // 罫線の終了位置
) where X : Plottable, Y : Plottable
RuleMark(
    x: .value("Pollen Source", $0.source),
    yStart: .value("Start Date", $0.startDate),
    yEnd: .value("End Date", $0.endDate)
)
RuleMark(
    y: .value("average", averageDate)
)
.foregroundStyle(.red)

RuleMarkのイニシャライザ3
init<Y>(
    x: CGFloat? = nil,
    yStart: PlottableValue<Y>,
    yEnd: PlottableValue<Y>
) where Y : Plottable
RuleMark(
    yStart: .value("Start Date", data[0].startDate),
    yEnd: .value("End Date", data[0].endDate)
)
RuleMark(
    x: 60, // 指定した位置に表示する
    yStart: .value("Start Date", data[1].startDate),
    yEnd: .value("End Date", data[1].endDate)
)

RectangleMark
ヒートマップなどに使う
RectabgleMarkのイニシャライザ1
init<X, Y>(
    x: PlottableValue<X>,
    y: PlottableValue<Y>,
    width: MarkDimension = .automatic, // Markのwidth
    height: MarkDimension = .automatic // Markのheight
) where X : Plottable, Y : Plottable
var data: [MatrixEntry] = [
    .init(positive: "+", negative: "+", num: 125),
    .init(positive: "+", negative: "-", num: 10),
    .init(positive: "-", negative: "-", num: 80),
    .init(positive: "-", negative: "+", num: 1)
]

public var body: some View {
    Chart(data) {
        RectangleMark(
            x: .value("Positive", $0.positive),
            y: .value("Negative", $0.negative)
        )
        .foregroundStyle(by: .value("Number", $0.num))
    }
    .aspectRatio(contentMode: .fit)
    .padding()
}

Chart(data) {
    RectangleMark(
        x: .value("Rect X", 3),
        y: .value("Rect Y", 3),
        width: .fixed(25),
        height: .fixed(25)
    )
    .opacity(0.2)
    PointMark(
        x: .value("X", $0.x),
        y: .value("Y", $0.y)
    )
}
.aspectRatio(contentMode: .fit)

RectabgleMarkのイニシャライザ2
init<X, Y>(
    x: PlottableValue<X>, // X軸上の位置
    yStart: PlottableValue<Y>, // Y軸上の開始位置
    yEnd: PlottableValue<Y>, // // Y軸上の終了位置
    width: MarkDimension = .automatic
) where X : Plottable, Y : Plottable
RectangleMark(
    x: .value("Rect X", 4),
    yStart: .value("Rect yStart", 2),
    yEnd: .value("Rect yEnd", 4),
    width: .fixed(30)
)

RectabgleMarkのイニシャライザ3
init<X, Y>(
    xStart: PlottableValue<X>,
    xEnd: PlottableValue<X>,
    yStart: PlottableValue<Y>,
    yEnd: PlottableValue<Y>
) where X : Plottable, Y : Plottable
RectangleMark(
    xStart: .value("Rect xStart", 2),
    xEnd: .value("Rect xEnd", 4),
    yStart: .value("Rect yStart", 2),
    yEnd: .value("Rect yEnd", 4)
)

RectabgleMarkのイニシャライザ4
init<X>(
    x: PlottableValue<X>,
    yStart: CGFloat? = nil,
    yEnd: CGFloat? = nil,
    width: MarkDimension = .automatic
) where X : Plottable
RectangleMark(
    x: .value("Rect X", 3)
)
RectangleMark(
    y: .value("Rect Y", 1)
)
.foregroundStyle(.red)

PointMark(
    x: .value("X", $0.x),
    y: .value("Y", $0.y)
)

RectabgleMarkのイニシャライザ5
init(
    xStart: CGFloat? = nil,
    xEnd: CGFloat? = nil,
    yStart: CGFloat? = nil,
    yEnd: CGFloat? = nil
)
RectangleMark()
    .opacity(0.2)

RectabgleMarkのイニシャライザ6
init<Y>(
    xStart: CGFloat? = nil,
    xEnd: CGFloat? = nil,
    yStart: PlottableValue<Y>,
    yEnd: PlottableValue<Y>
) where Y : Plottable
RectangleMark(
    yStart: .value("Rect yStart", 2),
    yEnd: .value("Rect yEnd", 4)
)

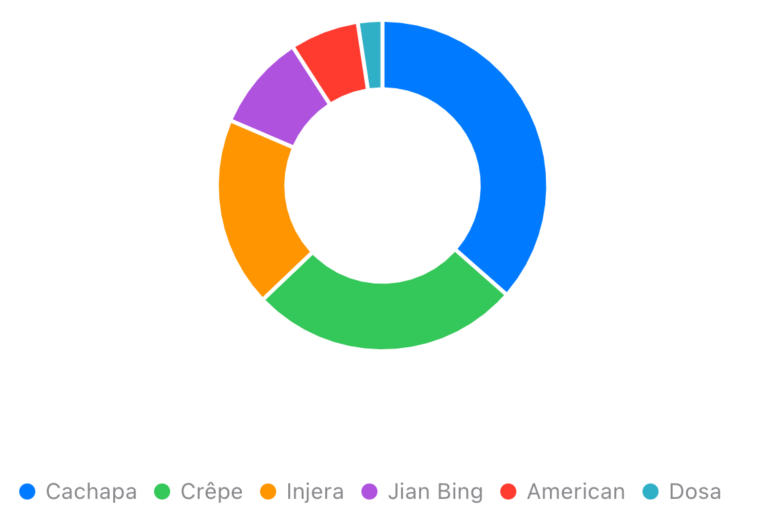
SectorMark
扇形グラフ(円グラフ・ドーナツグラフ)を描画する
init(
    angle: PlottableValue<some Plottable>, // データの値
    innerRadius: MarkDimension = .automatic, // 内円の半径の大きさ
    outerRadius: MarkDimension = .automatic, // 外円の半径の大きさ
    angularInset: CGFloat? = nil // 項目ごとの区切りの大きさ
)
引数angleに値を入れることで自動的に正規化された状態で表示される
.foregroundStyleなどでカテゴリーごとに色を変えないと全て青になるので注意
Chart(data) {
    SectorMark(angle: .value("Value", $0.sales))
        .foregroundStyle(by: .value("Food Category", $0.name))
}

innerRadiusを指定すると内円ができ、outerRadiusを指定すると外円ができる
Chart(data) {
    SectorMark(
        angle: .value("Value", $0.sales),
        innerRadius: .ratio(0.6),
        outerRadius: .inset(60),
        angularInset: 1
    )
    .foregroundStyle(by: .value("Food Category", $0.name))
}
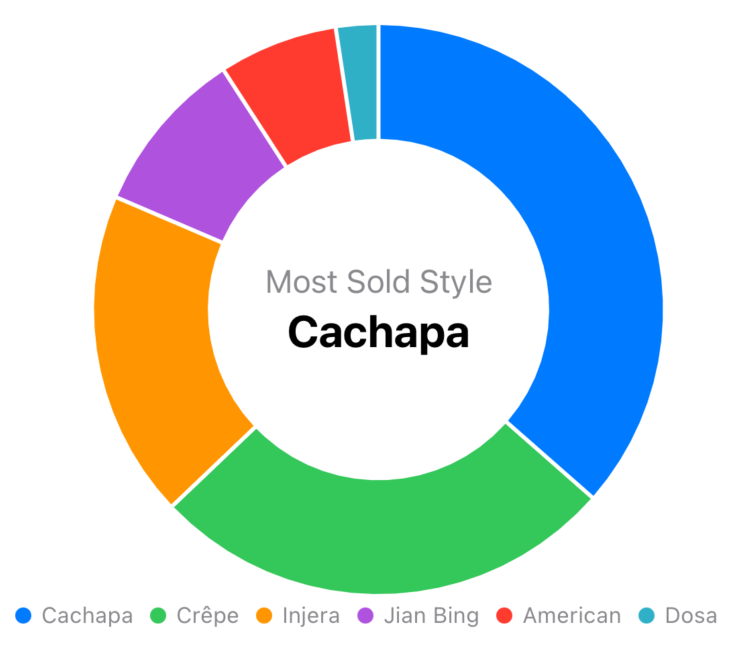
chartBackgroundを使って内円の中心にTextを表示することもできる
Chart {
	SectorMark(...)
}
.chartBackground { chartProxy in
    GeometryReader { geometry in
        let frame = geometry[chartProxy.plotAreaFrame]
        VStack {
            Text("Most Sold Style")
                .font(.callout)
                .foregroundStyle(.secondary)
            Text("Cachapa")
                .font(.title2.bold())
                .foregroundStyle(.primary)
        }
        .position(x: frame.midX, y: frame.midY)
    }
}
ChartContentで使えるメソッド
BarMarkやLineMarkなどのMarkはChartContentプロトコルに準拠している。
このChartContentに定義されているメソッドを通じてMarkのカスタマイズができる。
スタイリング系
グラフの色を変える
BarMark(
...
)
.foregroundStyle(.red)

ShapeStyleを指定するのでグラデーションの指定も可能
BarMark(
...
)
.foregroundStyle(
    LinearGradient(gradient: Gradient(colors: [.blue, .purple]), startPoint: .top, endPoint: .bottom)
)

styleをplotAreaに適用する
MarkのstyleをplotArea(表示領域)全体に合わせる
Markにグラデーションを適用した場合、plotArea全体をグラデーションの開始点/終了点に利用することになる
BarMark(
...
)
.foregroundStyle(
    LinearGradient(gradient: Gradient(colors: [.blue, .purple]), startPoint: .top, endPoint: .bottom)
)
.alignsMarkStylesWithPlotArea()
一番左のMarkを見ると先ほどのMarkよりグラデーションのかかり方が異なるのがわかる

不透明度の設定
BarMark(
...
)
.opacity(0.3)

角丸にする
BarMark(
...
)
.cornerRadius(15)
LineMarkのスタイルの設定
StrokeStyleに準拠していればいいので色々設定できそう。
LineMark(
...
)
// 線の太さを変更
.lineStyle(.init(lineWidth: 10))

曲線などにする
指定した補間(データポイント間の線や曲線を滑らかにする処理)方法でLineMarkとAreaMarkを描画する
LineMark(
...
)
// 滑らかな曲線
.interpolationMethod(.catmullRom)

- .linear
- 直線
- .catmullRom
- 滑らかな曲線
- .catmullRom(alpha:)
- 曲線の形状を制御する。0~1の間で値が高いほど曲線がデータポイントを厳密に通過しようとし、低いほどより滑らかな曲線になる(データポイントから外れる?)
- .cardinal
- .catmullRomより緩やかな曲線
- .cardinal(tension:)
- tension(張力)を指定できる。0~1の間で値が低いほど滑らかになり、高いほど直線になる
- .monotone
- 例外な値があっても不自然なひねりを避ける滑らかな曲線
- .stepCenter
- 階段状に表示する。データポイントはステップの中心になる

- .stepStart
- 階段状に表示する。データポイントはステップの開始位置になる
- .stepEnd
- 階段状に表示する。データポイントはステップの終了位置になる
グラフの後ろにViewを定義する
Chart {
...
}
.chartBackground { _ in
    Rectangle()
        .frame(width: 200, height: 100)
        .foregroundColor(.red)
}

グラフの前面にViewを定義する
Chart {
...
}
.chartOverlay { _ in
    Rectangle()
        .frame(width: 200, height: 100)
        .foregroundColor(.red)
}

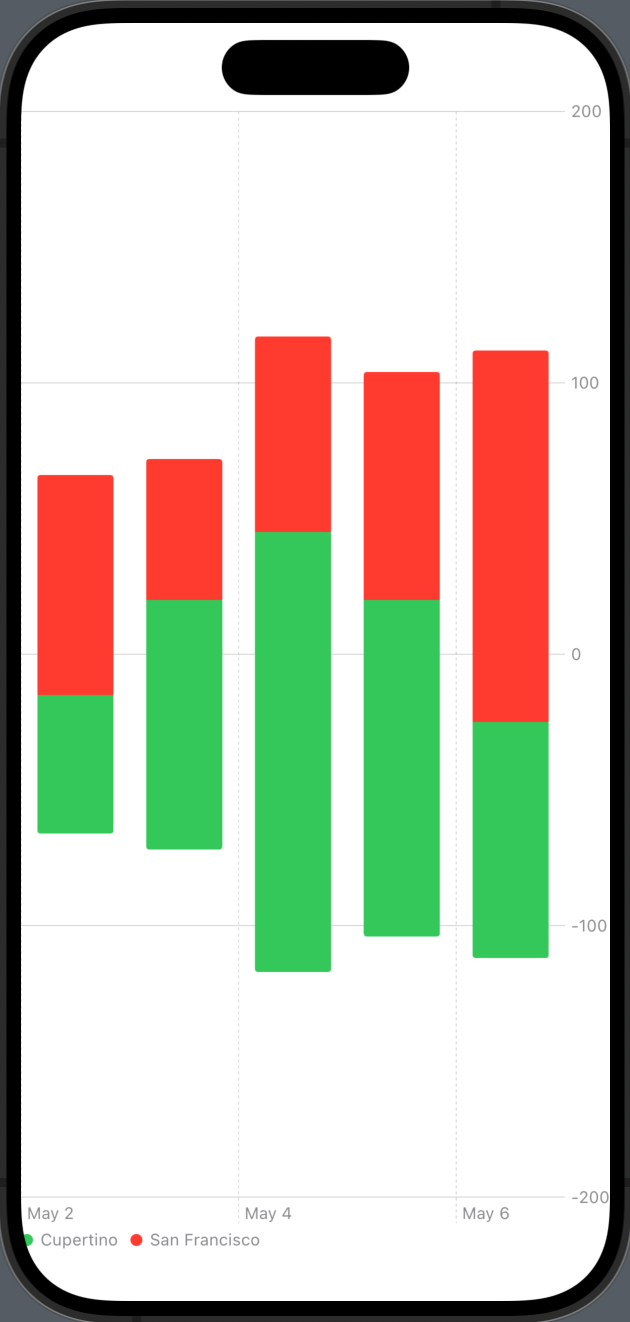
カテゴリに基づいてグラフを指定した色にする
Chart(salesByCityData) { citySale in
    ForEach(citySale.sales) {
        BarMark(
            x: .value("Day", $0.weekday, unit: .day),
            y: .value("Sales", $0.sales)
        )
        .foregroundStyle(by: .value("City", citySale.city))
    }
}
// カテゴリーに対して異なる色を指定する
.chartForegroundStyleScale([
    "Cupertino": .green, "San Francisco": .red
])

複数の指定方法がある(詳細はドキュメント)
struct StorageChartView: View {
    struct FileCategory {
        let fileSizePercent: Double
        let fileCategory: String
        let color: Color
    }

    let data: [FileCategory] = [
        .init(fileSizePercent: 50, fileCategory: "Applications", color: .red),
        .init(fileSizePercent: 10, fileCategory: "Photos", color: .orange),
        .init(fileSizePercent: 5, fileCategory: "Music", color: .yellow),
        .init(fileSizePercent: 3, fileCategory: "Podcasts", color: .green),
        .init(fileSizePercent: 10, fileCategory: "iOS", color: .gray),
        .init(fileSizePercent: 10, fileCategory: "System Data", color: .black),
    ]

    var body: some View {
        Chart(data, id: \.fileCategory) {
            BarMark(
                x: .value("File Size Percent", $0.fileSizePercent)
            )
            .foregroundStyle(by: .value("File Category", $0.fileCategory))
        }
        .chartForegroundStyleScale(domain: data.map { $0.fileCategory }, range: data.map { $0.color })
        .chartXAxis(.hidden)
        .frame(height: 50)
        .padding()
    }
}

plotAreaのスタイリングをする
Chart {
...
}
.chartPlotStyle { content in
    content
        .background(.gray.opacity(0.2)) // 背景色を追加
        .border(.black) // 境界線を追加
}

位置系
offset
Markの位置をずらす
BarMark(
    x: .value("Category", $0.category),
    y: .value("value", $0.value)
)
// 右に50、下に50ずらす
.offset(CGSize(width: 50, height: 50))
// .offset(x: 50, y: 50)

offset(x:yStart:yEnd:)
MarkのY軸の開始位置と終了位置のそれぞれに異なるoffsetを指定し、さらにX軸にoffsetを指定できる。
BarMark(
...
)
.offset(x: 0, yStart: 0, yEnd: 10)

offset(xStart:xEnd:y:)
MarkのX軸の開始位置と終了位置のそれぞれに異なるoffsetを指定し、さらにY軸にoffsetを指定できる
BarMark(
...
)
// 各MarkのX軸の終了位置を20右にずらす
.offset(xStart: 0, xEnd: 20, y: 0)

offset(xStart:xEnd:yStart:yEnd:)
Markのx軸とy軸それぞれの開始位置と終了位置を指定できる
シンボルの外観の設定
シンボルの外観を変える
指定できるのはChartSymbolShapeに準拠したもの
PointMark(
...
)
.symbol(.asterisk)
- .symbol(.asterisk) アスタリスク

- .symbol(.circle) 円

- .symbol(.cross) クロス(×)

- .symbol(.diamond) ひし形

- .symbol(.pentagon) 五角形

- .symbol(.plus) プラス(+)

- .symbol(.square) 四角

- .symbol(.triangle) 三角

シンボルの線の太さを変えることや、破線にすることなども可能
.symbol(.circle.strokeBorder(lineWidth: 1))
.symbol(.circle.strokeBorder(style: StrokeStyle(lineWidth: 1, dash: [2, 2])))
任意のViewをシンボルにする
PointMark(
...
)
.symbol {
    Image(systemName: "heart.fill")
        .foregroundStyle(.red)
}

シンボルサイズの変更
PointMark(
...
)
.symbol(.circle)
.symbolSize(10)

小さくすることはいくらでも可能っぽいが、確認した限り一定値以上は大きくできない。
また、独自のシンボルを設定した場合はサイズが適用されない(独自シンボルのView側で指定すればよさそう)
カテゴリーごとに異なるシンボルを設定する
var salesByCityData: [SalesByCity] {[
    .init(city: "Cupertino", sales: cupertinoData),
    .init(city: "San Francisco", sales: sfData)
]}
...
Chart(salesByCityData) { citySale in
    ForEach(citySale.sales) {
        PointMark(
            x: .value("Day", $0.weekday, unit: .day),
            y: .value("Sales", $0.sales)
        )
        .foregroundStyle(by: .value("City", citySale.city))
        .symbol(by: .value("City", citySale.city))
    }
}

// カテゴリーに対して異なるシンボルを適用する
.chartSymbolScale([
    "Cupertino": Circle(), "San Francisco": Circle().strokeBorder(lineWidth: 1)
])

カテゴリーごとに異なるシンボルサイズを適用する?
chartSymbolSizeScale(_:)というのがあるが、使い方がよくわからない
データごとに外観を変える
foregroundStyle(by:)
指定したデータの値ごとに異なる色やスタイルを適用する
BarMark(
    x: .value("Department", $0.department),
    y: .value("Profit", $0.profit)
  )
  .foregroundStyle(by: .value("Department", $0.department))
lineStyle(by:)
指定したデータの値ごとに異なる線のスタイル(実線や破線)を適用する
Chart(departmentProfits) { departmentProfit in
    ForEach(departmentProfit.profitOverTIme, id: \.date) {
       LineMark(
          x: .value("Date", $0.date, unit: .month),
          y: .value("Profit", $0.profit)
       )
       .lineStyle(by: .value("departmentName", departmentProfit.name))
    }
}

chartLineStyleScale
lineStyle(by:)に加え、具体的にどのスタイルを適用するかを指定する
Chart(departmentProfits) { departmentProfit in
    ForEach(departmentProfit.profitOverTIme, id: \.date) {
       LineMark(
          x: .value("Date", $0.date, unit: .month),
          y: .value("Profit", $0.profit)
       )
       .lineStyle(by: .value("departmentName", departmentProfit.name))
    }
}
.chartLineStyleScale([
    "A": StrokeStyle(lineWidth: 2),
    "B": StrokeStyle(lineWidth: 5, dash: [5, 5])
])

position(by:axis:span:)
指定したデータの値ごとにMarkの位置を決定する
axisで.horizontalと.verticalのどちらに沿ってMarkを配置するかを決める
spanでMarkが占める範囲を指定する(MarkDimension)
ForEach(stackedBarData) { shape in
   BarMark(
      x: .value("Shape Type", shape.type),
      y: .value("Total Count", shape.count)
   )
   // 各BarMark内の要素に応じて色を変える
   .foregroundStyle(by: .value("Shape Color", shape.color))
   // 指定したデータごとにMarkの位置をずらす(.horizontal)
   .position(by: .value("Shape Color", shape.color), span: .fixed(100))
}

axisで.verticalを指定すると通常の縦型になる
.position(by: .value("Shape Color", shape.color), axis: .vertical ,span: .fixed(100))
symbol(by:)
指定したデータの値ごとに異なるシンボルを設定する
ForEach(departmentProfit.profitOverTIme, id: \.date) {
   LineMark(
      x: .value("Date", $0.date, unit: .month),
      y: .value("Profit", $0.profit)
   )
   .symbol(by: .value("departmentName", departmentProfit.name))
}
わかりにくいが円と四角のシンボルで分かれている

symbolSize(by:)
指定したデータの値ごとに異なるサイズのシンボルを設定する
Chart(participants, id: \.age) { participant in
   PointMark(
      x: .value("Age", participant.age),
      y: .value("Weight", participant.weight)
   )
   .symbolSize(by: .value("Weight", participant.weight))
}

注釈をつける
annotation(position:alignment:spacing:content:)
Markに対してViewで注釈をつけれる
- position: Markに対する相対的な位置
- alignment: 位置
- spacing: Markからどのくらい離すか
Chart(sales) { sale in
    BarMark(
        x: .value("Department", sale.department),
        y: .value("Profit", sale.profit)
    )
    .annotation(position: .top, alignment: .center, spacing: 20) {
        Text("利益: \(sale.profit)")
            .font(.caption)
            .frame(width: 100, height: 40)
            .background(.gray)
    }
}

Maskingとclipping
Maskする
チャートのコンテンツの一部を強調したり、特定の範囲のみ表示するために使用
BarMark(
    x: .value("Department", sale.department),
    y: .value("Profit", sale.profit)
)
.mask {
    if sale.department == "Marketing" {
        RectangleMark()
    } else {
        RectangleMark()
            .foregroundStyle(Color.black.opacity(0.5))
    }
}

角丸などにclippingする
Shapeに準拠していればいいので他にもいろんな形状にクリッピングできそう
BarMark(
...
)
.clipShape(.rect(
    topLeadingRadius: 20,
    bottomLeadingRadius: 0,
    bottomTrailingRadius: 0,
    topTrailingRadius: 20
))

Accessibilityの設定
Instance Methods
annotation(position:alignment:spacing:overflowResolution:content:)
注釈をつけるannotation(position:alignment:spacing:content:)と同じだが、overflowResolution引数が追加された。
通常だとPlotArea内に注釈を表示するが、グラフのPlotArea外に表示することが可能になる
iOS17+
LineMark(...)
...
.annotation(
    position: .top,
    spacing: 0,
    overflowResolution: .init(
        x: .fit(to: .chart), // X軸では注釈がグラフの端の境界を超えないようにfitさせる
        y: .disabled // Y軸では注釈がグラフのすぐ上に来るようにするようにオーバーフロー解決を無効にする
    )
) {
    Text(...)
}
Markをぼかす
特定のデータを強調表示して他の部分を目立たなくするために使用できる
iOS 16.4+
BarMark(
...
)
.blur(radius: 4)

各Markに対して処理を行う
iOS17+
BarMark(
...
)
.compositingLayer {
     $0.opacity(0.5)
}

Markに影をつける
iOS16.4+
BarMark(
...
)
.shadow(color: .red, radius: 2, x: 3, y: 5)
radius: 影のぼかしの強さ

重なっているMarkの表示順を指定する
指定する値が大きいほど手前に来る
BarMark(
...
)
.zIndex(2) // BarMarkが手前
AreaMark(
...
)
.foregroundStyle(.red)
.zIndex(1)
MarkStacking Method
MarkをStackする方法を指定する。BarMarkなどのMarkの一部のイニシャライザなどで指定することが可能。ドキュメント見ると良さそう
BarMark(
    x: .value("Day", $0.weekday, unit: .day),
    y: .value("Sales", $0.sales),
    stacking: .standard // BarMarkでいうこの部分
)
.foregroundStyle(by: .value("City", citySale.city))
- .standard
- 通常のStack方法

- .center
- 各Markの中心点が中央に来るようにする
- .normalized
- 正規化する(各MARKの合計値を100%とする)

- unstacked
- MarkをStackしない
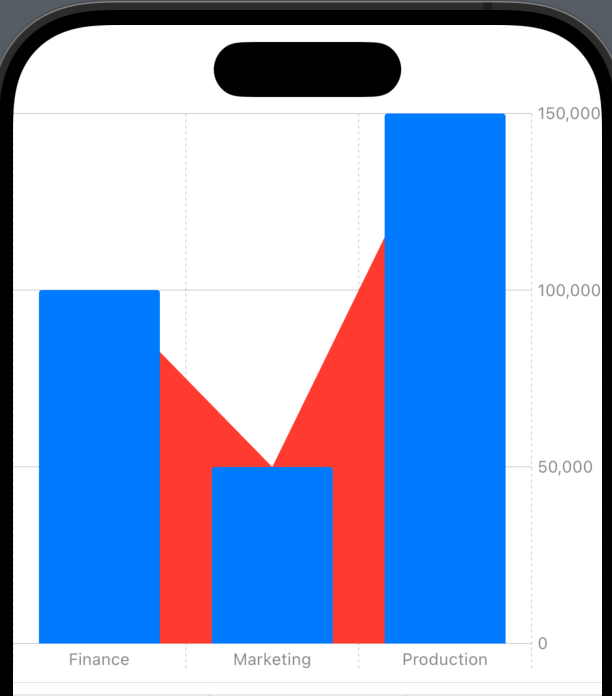
通常、値が重なっているとMarkが上にstackされ、その2つの合計値が表示される
- MarkをStackしない
var sales: [Sale] = [
		// 同じ値が2つある場合
    .init(department: "Finance", profit: 200),
    .init(department: "Finance", profit: 200),
    .init(department: "Marketing", profit: 500),
    .init(department: "Production", profit: 150)
]
...
BarMark(
    x: .value("Department", sale.department),
    y: .value("Profit", sale.profit),
    stacking: .standard
)

.unstackedにすることで、上にstackされないようになる
BarMark(
    x: .value("Department", sale.department),
    y: .value("Profit", sale.profit),
    stacking: .unstacked
)

MarkDimension
各Markのwidthかheightを表す寸法
BarMarkのイニシャライザで横幅を指定するときなどに使用。
BarMark(
    x: .value("Category", $0.category),
    y: .value("value", $0.value),
    width: .fixed(30), // 横幅を30に固定
    stacking: .center // 各Markの中心点が中央に来るように
)
- init(floatLiteral: Double)
- Double型から直接幅を指定する
- init(integerLiteral: Int)
- Int型から直接幅を指定する
- fixed(CGFloat) → MarkDimension
- 固定値として幅を指定する
- inset(CGFloat) -> MarkDimension
- step size(Markごとに割り当てられた間隔)の両側からどの程度間隔を大きくするか
- ratio(CGFloat) → MarkDimension
- step sizeに対しての比率で幅を指定する
PlottableValue
chartにplot(表示)するラベル付きのデータのこと。
↓でいう.value()のこと。
BarMark(
   x: .value("Category", $0.category), // この.value
   y: .value("Quantity", $0.value)
)
時間をデータとして使用する場合、その時間のどの要素を使用するか指定できる
.value("Date", item.date, unit: .day)
色んな指定方法があるので詳細はドキュメントを参照
Plot
複数のMarkを1つにまとめ、複合的なグラフを作成するたのメカニズム。Chart{}を使うと必然的に内部で使っている(?)
ChartとPlotは同じChartContentなので、以下のような記述もできる。
struct Chart<Content> where Content : ChartContent

struct Plot<Content> where Content : ChartContent
Chart {
   Plot {
      BarMark(x: .value("a", 1), y: .value("e", 2))
   }
}
おそらく独自のMarkを作成するために使用する
struct CustomMark: ChartContent {
    let xValue: PlottableValue<String>
    let yValue: PlottableValue<Double>

    var body: some ChartContent {
        Plot {
            LineMark(x: xValue, y: yValue)
            PointMark(x: xValue, y: yValue)
        }
    }
}

...
public var body: some View {
	Chart(sales) {
	    CustomMark(xValue: .value("Department"$0.department), yValue: .value("Profit", $0.profit))
	}
}

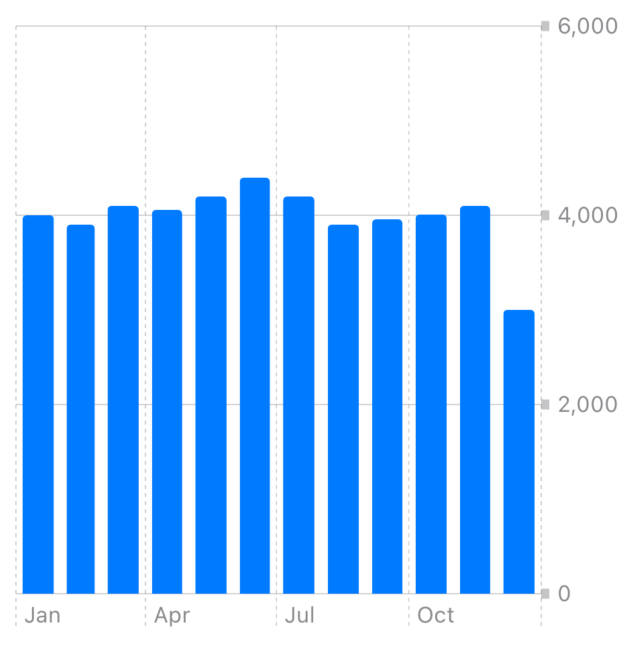
軸のカスタマイズ
ここでは以下のグラフを基に軸をカスタマイズしていく
let data: [Sales] = [
    .init(date: date(2023, 1, 1), sales: 4000),
    .init(date: date(2023, 2, 1), sales: 3900),
    .init(date: date(2023, 3, 1), sales: 4100),
    .init(date: date(2023, 4, 1), sales: 4060),
    .init(date: date(2023, 5, 1), sales: 4200),
    .init(date: date(2023, 6, 1), sales: 4400),
    .init(date: date(2023, 7, 1), sales: 4200),
    .init(date: date(2023, 8, 1), sales: 3900),
    .init(date: date(2023, 9, 1), sales: 3960),
    .init(date: date(2023, 10, 1), sales: 4010),
    .init(date: date(2023, 11, 1), sales: 4100),
    .init(date: date(2023, 12, 1), sales: 3000)
]
...
 Chart(data, id: \.date) {
    BarMark(
        x: .value("Month", $0.date, unit: .month),
        y: .value("Sales", $0.sales)
    )
}
.frame(width: 300, height: 300)

軸の基本構成
.chartXAxis、.chartYAxisで各軸のカスタマイズをする。
基本的にAxisMarksを定義し、その中で軸の目盛りやラベルのスタイル、位置などを定義する
Chart {
...
}
.chartXAxis {
	AxisMarks {
	    ... // 軸の要素を定義する
	}
}
.chartYAxis {
    AxisMarks() // 引数も何も指定しない場合はデフォルトの状態を提供する
}
AxisMarks
複数のイニシャライザが存在する。ここでは一部だけ掲載。
AxisMarksのイニシャライザ1
init(
    preset: AxisMarkPreset = .automatic, // 目盛りなどに対する軸の位置
    position: AxisMarkPosition = .automatic, // 上下左右での軸の位置
    values: AxisMarkValues = .automatic, // Markをどのように配置するか
    stroke: StrokeStyle? = nil // 線のスタイルを指定
) where Content == Never
全てにデフォルト引数があるので↓に該当
.chartYAxis {
    AxisMarks {
      ...
    }
    AxisMarks()
}
AxisMarksのイニシャライザ2
Chart {
...
}
.chartYAxis {
    AxisMarks(
        format: Decimal.FormatStyle.Percent.percent.scale(1), // %表記
        preset: .aligned, // データに対して整列
        position: .leading, // 軸を左側に配置
        values: .automatic(desiredCount: 3), // 可能であれば3つ配置
        stroke: StrokeStyle(lineWidth: 3) // 線の太さを変更
    )
}

引数valuesではAxisMarkValues型の値を指定する。
以下の指定が可能
.automatic(
   desiredCount: 3, // 目標とするAxisMarkの数。分数とか綺麗な値にならない場合は指定した数値に必ずしもならない
   roundLowerBound: true, // 軸の下限値を丸めるか。trueで0や5など綺麗な値になる
   roundUpperBound: true // 軸の上限値を丸めるか。trueでより綺麗な値になる
)

.automatic(
   minimumStride: 20, // 隣接するAxisMarkとの最小距離。大きくするとMarkの間隔が広がり、軸上のMarkの数が少なる
   desiredCount: 3,
   roundLowerBound: true,
   roundUpperBound: true
)

.stride(
    by: .hour, // 指定したカレンダーの単位に従って値を生成する
    count: 2, // 指定した数の間隔で値を生成する
    roundLowerBound: true,
    roundUpperBound: true,
    calendar: .curren //どのカレンダー(グレゴリオ暦やユリウス暦)に基づくか
)

.stride(
    by: 5, // 指定した間隔で値を生成する
    roundLowerBound: true,
    roundUpperBound: true
)
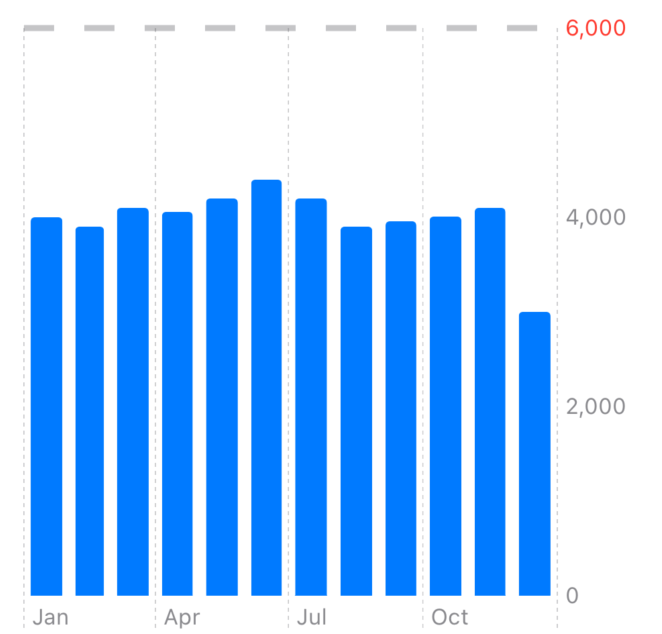
AxisMarksのイニシャライザ3
表示する目盛りの値を指定できる。
AxisMarks(
   values: [0, 1000, 1500, 5000]
)

軸の要素を定義する
AxisMarksに定義するのはラベル、目盛り、グリッド線の3要素。
AxisMarks{}で何も定義してないと軸が空になる
Chart {
...
}
.chartXAxis {
	AxisMarks {
	// 空の場合
	}
}

ラベル
.chartXAxis {
   AxisMarks {
      AxisValueLabel() // ラベル
   }
}

目盛り
.chartXAxis {
   AxisMarks {
      AxisValueLabel()
      AxisTick() // 目盛り
   }
}
分かりにくいが目盛りはラベルの横に出ている小さい線

グリッド線
.chartXAxis {
   AxisMarks {
      AxisValueLabel()
      AxisTick()
      AxisGridLine() // グリッド線
   }
}

軸の要素の色やフォントを変える
ラベル(AxisValueLabel), 目盛り(AxisTick), グリッド線(AxisGridLine)はAxisMarkプロトコルに準拠しているのでAxisMarks{}で定義できる。
AxisMarkプロトコルでは以下のようなmodifireが提供されている
AxisValueLabel() // ラベル
    .font(.title3)
    .foregroundStyle(.red)
    .offset(x: 30)
AxisTick() // 目盛り
    .foregroundStyle(.red)
AxisGridLine() // グリッド線
    .foregroundStyle(.green)

ラベルのカスタマイズ
AxisValueLabelでは以下の設定が可能
AxisValueLabel(
    centered: true, // 軸ラベルが目盛りに対して中心に配置されるか
    anchor: .top, // ラベルのどの部分が指定した位置に固定されるか
    multiLabelAlignment: .bottom, // 複数のラベルが存在する場合の水平方向での整列方法を指定
    collisionResolution: .automatic, // ラベル間の衝突(重なり)を解決する方法を指定
    offsetsMarks: true, // Labelの位置に応じて目盛りをずらすかを指定
    orientation: .horizontal, // Labelの向きを指定。verticalで縦向きになる
    horizontalSpacing: 10, // Label間の水平の距離を指定
    verticalSpacing: 5 // Label間の垂直の距離を指定
)
指定した文字列を表示することも可能。データセットにはない文字列を扱う場合に使いそう
AxisValueLabel("label")

ラベルのFormatの変更
// 時(h)で表示
AxisValueLabel(format: .dateTime.hour())
// 少数第二位まで表示
AxisValueLabel(format: Decimal.FormatStyle.number.precision(.fractionLength(2)))
// 四半期スタイルで表示(例: Q1 20223)
AxisValueLabel(format: .dateTime.year().quarter())
Label自体のViewを自分で設定する
AxisMarks { value in
    AxisValueLabel {
		    // ここで定義したViewがLabelとして表示される
        if let intValue = value.as(Int.self) {
            HStack(spacing: 0) {
                Text("\(intValue)")
                    .fixedSize()
                Image(systemName: "heart.fill")
            }
            .foregroundStyle(.red)
        }
    }
}

目盛りのカスタマイズ
AxisTickでは以下の設定が可能
AxisTick(
   centered: false, // 目盛りが軸ラベルに対して中心に配置されるか
   length: 20, // 目盛の長さ (CGFloat型)
   stroke: .init(lineWidth: 5) // 目盛り線のスタイル
)
lengthはAxisTick.Length型での指定により動的に変更することも可能
AxisTick(
   length: .automatic, // 目盛の長さ (AxisTick.Length型)
)
- .automatic
- 目盛りの長さを自動的に決定する
- .label
- Labelの幅と同じ長さにする
AxisMarks { value in
    if value.index == value.count - 1 {
        AxisValueLabel("長いラベル長いラベル", anchor: .topLeading)
    } else {
        AxisValueLabel(anchor: .topLeading)
    }
    AxisGridLine()
    AxisTick(
        centered: false,
        length: .label, // .labelの幅と同じ長さ
        stroke: .init(lineWidth: 2) // 目盛り線のスタイル
    )
}
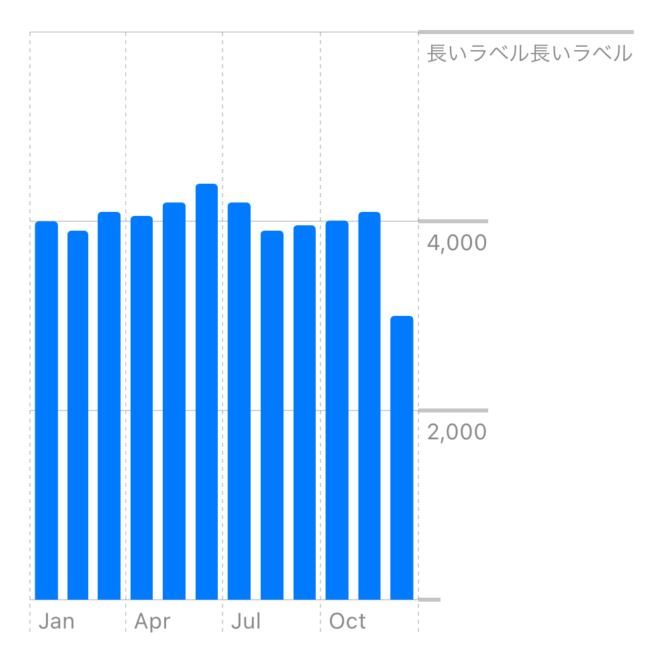
- .longestLabel
- 全ての目盛りの長さを、最も長いLabelの幅と同じ長さにする

グリッド線のカスタマイズ
AxisGridLineでは以下の設定が可能
AxisGridLine(
    centered: true, // グリッド線が軸ラベルに対して中心に配置されるか
    stroke: .init(lineWidth: 2, lineCap: .round, dash: [110]) // グリッド線のスタイル
)

データに応じて軸の内容を変える
AxisMarksではクロージャの引数としてAxisValue型のvalueを提供する。
.as()を用いて実際の型にキャストすることで、データの値に応じて軸の内容を変えることができる。
AxisMarks { value in
    if let intValue = value.as(Int.self) {
        if intValue > 2000 {
            AxisValueLabel()
                .font(.title)
            AxisGridLine(stroke: .init(lineWidth: 5))
                .foregroundStyle(.red)
        } else {
            AxisValueLabel(orientation: .vertical)
            AxisGridLine()
        }
    }
}

また、データの総数を取得したり
AxisMarks { value in
    if value.count > 5 { // データの総数

    }
}
データのindexにもアクセスできるので、一番最初や最後の値を強調する時などに使える
AxisMarks { value in
    // データのインデックス
    if value.index == value.count - 1 {
        // 一番最後のindexの場合はラベルを赤くする
        AxisValueLabel()
            .foregroundStyle(.red)
        AxisGridLine(stroke: .init(lineWidth: 3, dash: [15, 15]))
    } else {
        AxisValueLabel()
    }
}
軸のスタイルの設定
Chart {
...
}
.chartXAxisStyle { axis in
    axis.opacity(0.5)
}

軸にラベルを追加する
Chart {
...
}
.chartXAxisLabel(position: .leading, alignment: .top, spacing: 20) {
    Text("ラベルを追加できる")
        .font(.title)
}
// .chartXAxisLabel("ラベルを追加できる", position: .leading, alignment: .top, spacing: 20)

データの表示範囲の指定
Chart {
...
}
.chartYScale(domain: 0...5000)

各AxisMarkに対してそれぞれ処理を行う
AxisMarks {
    AxisValueLabel()
    AxisTick()
    AxisGridLine()
}
.compositingLayer() {
    $0.opacity(0.5) // 透明度を0.5
}
軸、凡例の非表示
Chart {
...
}
.chartXAxis(.hidden)
.chartYAxis(.hidden)
.chartLegend(.hidden)
凡例の位置を指定する
.chartLegend(
    position: .top, // 凡例の位置
    alignment: .trailing, // 右側に整列
    spacing: 50 // 凡例とチャートとの幅
)

凡例のViewを作る
.chartLegend(
    position: .top,
    alignment: .trailing,
    spacing: 10
) {
    HStack(spacing: 0) {
        ForEach(salesByCityData) { citySale in
            Image(systemName: "gearshape")
            Text("\(citySale.city)")
                .font(.caption)
        }
    }
}

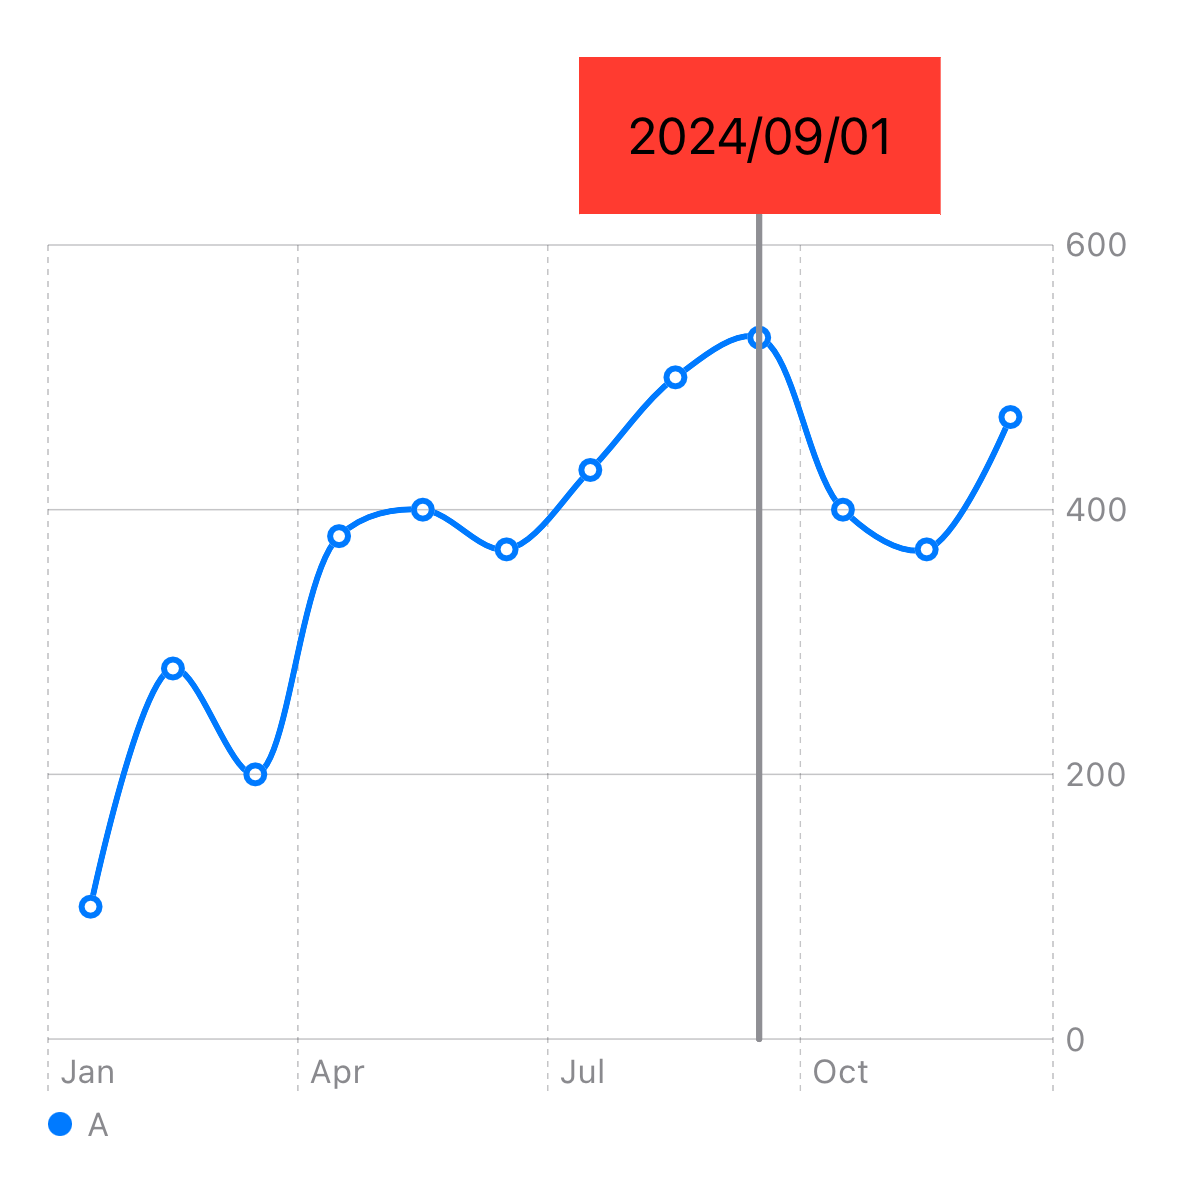
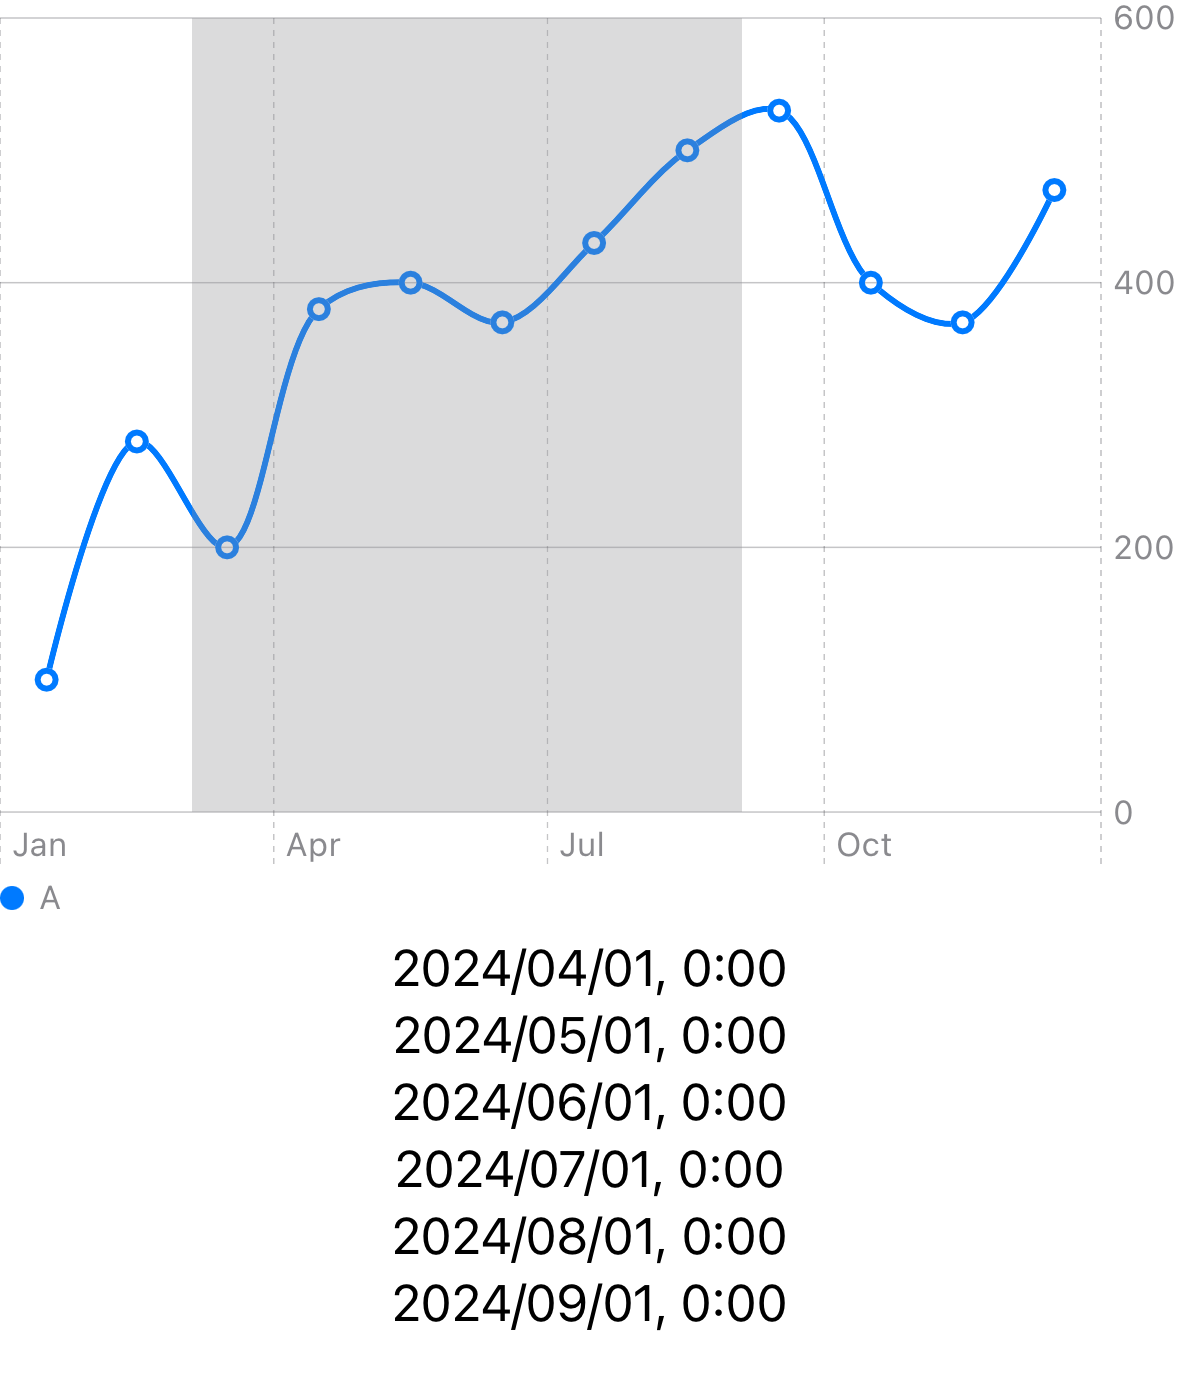
グラフをインタラクティブに扱う
.chartXSelection(value:)
.chartXSelection(value:)を利用することでX軸上のグラフの値を取得し、Bindingすることができる。
全てのジェスチャを認識して処理してくれる。
(iOS17 +)
// 利益
struct ProfitOverTime {
    var date: Date
    var profit: Double
}

// 利益データ
var data: [ProfitOverTime] {
    [
        ProfitOverTime(date: date(2024, 1, 1), profit: 100),
        ProfitOverTime(date: date(2024, 2, 1), profit: 280),
        ProfitOverTime(date: date(2024, 3, 1), profit: 200),
        ProfitOverTime(date: date(2024, 4, 1), profit: 380),
        ProfitOverTime(date: date(2024, 5, 1), profit: 400),
        ProfitOverTime(date: date(2024, 6, 1), profit: 370),
        ProfitOverTime(date: date(2024, 7, 1), profit: 430),
        ProfitOverTime(date: date(2024, 8, 1), profit: 500),
        ProfitOverTime(date: date(2024, 9, 1), profit: 530),
        ProfitOverTime(date: date(2024, 10, 1), profit: 400),
        ProfitOverTime(date: date(2024, 11, 1), profit: 370),
        ProfitOverTime(date: date(2024, 12, 1), profit: 470),
    ]
}

@State var rawSelectedDate: Date?
var selectedDate: Date? {
    // グラフから受け取った生の値(rawSelectedDate)と、dataの配列の各日付の時間差を比較し、最も近い日付を返す
    guard let rawDate = rawSelectedDate else { return nil }
    let closest = data.min(by: { abs($0.date.timeIntervalSince(rawDate)) < abs($1.date.timeIntervalSince(rawDate)) })
    return closest?.date
}

public var body: some View {
    VStack {
        Chart(data, id: \.date) {
            LineMark(
                x: .value("Date", $0.date, unit: .month),
                y: .value("Profit", $0.profit)
            )
            .interpolationMethod(.catmullRom)
            .symbol(by: .value("departmentName", "A"))
            if let selectedDate {
                // 選択した時にRuleMarkを追加
                RuleMark(
                    x: .value("Selected", selectedDate, unit: .month)
                )
                .foregroundStyle(.gray.opacity(0.3))
                .offset(yStart: -10)
                .zIndex(-1)// RuleMarkがLineMarkの後ろに来るように。defaultは0
                .annotation( // 注釈の作成
                    position: .top, //
                    spacing: 0,
                    overflowResolution: .init(
                        x: .fit(to: .chart), // X軸では注釈がグラフの端の境界を超えないようにfitさせる
                        y: .disabled // Y軸では注釈がグラフのすぐ上に来るようにするようにオーバーフロー解決を無効にする
                    )
                ) {
                    Text(selectedDate, format: Date.FormatStyle(date: .numeric, time: .none))
                        .padding()
                        .background(Color.red)
                }
            }
        }
        .chartXSelection(value: $rawSelectedDate) // タップした位置のX軸上の値を取得
        .frame(height: 300)
        .padding()

    }
}
.chartXSelection(range:)
.chartXSelection(range:)を利用することで2本指でタップしている範囲を取得することも可能
(iOS17 +)

@State var rawSelectedRange: ClosedRange<Date>?
...
Chart {
    LineMark(...)
    ...
    if let rawSelectedRange { // 2本指で選択した範囲を描画する
    RectangleMark(
        xStart: .value("Index", rawSelectedRange.lowerBound),
        xEnd: .value("Index", rawSelectedRange.upperBound)
    )
    .foregroundStyle(.blue.opacity(0.03 ))
}
.chartXSelection(range: $rawSelectedRange) // 2本指でタップした時のrangeも取れる
...
カスタムジェスチャを利用する
chartGestureを用いることで、独自のジェスチャに対して選択位置をグラフに通知することができる。
以下の例ではDragGestureを用いてドラッグの開始値と現在値の値を選択状態としてprxyに通知している

@State private var selectedDay: ClosedRange<Int>?
...
Chart {
    LineMark(
        x: .value("Day", data.day),
        y: .value("Sales", data.sales)
    )
    if let selectedDay {
        RectangleMark(
            xStart: .value("value", selectedDay.lowerBound),
            xEnd: .value("a", selectedDay.upperBound)
        )
    }
}
.chartXScale(domain: 1...7)
.chartXSelection(range: $selectedDay)
.chartGesture { proxy in
    DragGesture(minimumDistance: 0)
        .onChanged { value in
            // ドラッグの開始値と現在値を選択させる
            proxy.selectXRange(from: value.startLocation.x, to: value.predictedEndLocation.x)
            // 範囲ではなくタップしている位置のみを選択する場合
            // proxy.selectXValue(at: value.location.x)
        }
        .onEnded { _ in
            selectedDay = nil
        }
}
.chartAngleSelection(value:)
SectorMarkでは.chartAngleSelection(value:)を利用する

struct Food: Identifiable{
    let name: String
    let sales: Int
    var id: String { name }
}

let data: [Food] = [
    .init(name: "Cachapa", sales: 9631),
    .init(name: "Crepe", sales: 6959),
    .init(name: "Injera", sales: 4891),
    .init(name: "Jian Bing", sales: 2506),
    .init(name: "American", sales: 1777),
    .init(name: "Dosa", sales: 625),
]

@State var selectedAngle: Int?
var selectedName: String? {
    guard let selectedAngle else { return nil }
    // 売上の大きい順に並び替え
    let sortedData = data.sorted { $0.sales > $1.sales }
    // 売上を累積してselectedAngleを超えたらその名前を返す
    var accumulatedSales = 0
    for food in sortedData {
        accumulatedSales += food.sales
        if selectedAngle < accumulatedSales {
            return food.name
        }
    }
    return nil
}

var body: some View {
    VStack {
        Chart(data) {
            SectorMark(
                angle: .value("Value", $0.sales),
                innerRadius: .ratio(0.6),
                angularInset: 1
            )
            .foregroundStyle(by: .value("Food Category", $0.name))
            .opacity($0.name == selectedName ? 1.0 : 0.3)
        }
        .chartAngleSelection(value: $selectedAngle) // タップした位置のAngleを取得

        .frame(height: 300)
    }
    .padding()
    .chartBackground { chartProxy in
        GeometryReader { geometry in
            let frame = geometry[chartProxy.plotAreaFrame]
            VStack {
                Text("Tapped Food")
                    .font(.callout)
                    .foregroundStyle(.secondary)
                Text(selectedName ?? "nil")
                    .font(.title2.bold())
                    .foregroundStyle(.primary)
            }
            .position(x: frame.midX, y: frame.midY)
        }
    }
}
iOS16の場合
グラフをインタラクティブに扱うには、iOS17では.chartXSelection(value:)が利用できるが、iOS16の場合は.chartOverlay(alignment:content:)を利用する必要がある。
.chartOverlay(alignment:content:)を利用することで、グラフの前面にDragGesture()などを付与したRectangleを配置し、インタラクティブに扱うことが可能となる。
また、.chartOverlay(alignment:content:)ではグラフのplotAreaにアクセスするためのProxyを得ることができる。
このProxyを使ってデータ値をスクリーン座標に変換したり、その逆に変換したりできる。
以下はドラッグジェスチャーによってスクリーン座標をデータ値に変換する例。
ドラッグした部分のpriceの値を出力している
struct SalesData: Identifiable {
    let id = UUID()
    let year: String
    let price: Int
}

struct ContentView: View {
    let data: [SalesData] = [
        SalesData(year: "2020", price: 200),
        SalesData(year: "2021", price: 400),
        SalesData(year: "2022", price: 600),
        SalesData(year: "2023", price: 800)
    ]

    var body: some View {
        Chart(data) {
            LineMark(
                x: .value("year", $0.year),
                y: .value("price", $0.price)
            )
        }
        .chartOverlay { proxy in // proxyを取得
            GeometryReader { geometry in // 座標を取得
            // ドラッグジェスチャーに適応するように構成された透明な長方形のView
                Rectangle().fill(.clear).contentShape(Rectangle())
                    .gesture(
                        DragGesture()
                            .onChanged { value in
                                // ジェスチャーの位置をPlotAreaの座標空間に変換
                                let origin = geometry[proxy.plotFrame!].origin
                                let location = CGPoint(
                                    x: value.location.x - origin.x,
                                    y: value.location.y - origin.y
                                )
                                // 座標からyearとpriceの値を取得する
                                if let (date, price) = proxy.value(at: location, as: (String, Int).self) {
                                    print("Location: \(date), \(price)")
                                }
                            }
                    )
            }
        }
    }
}
以下はドラッグの開始位置から終了位置までの値を出力する例
// 利益
struct ProfitOverTime {
    var date: Date
    var profit: Double
}

// 利益データ
var data: [ProfitOverTime] {
    [
        ProfitOverTime(date: date(2024, 1, 1), profit: 100),
        ProfitOverTime(date: date(2024, 2, 1), profit: 280),
        ProfitOverTime(date: date(2024, 3, 1), profit: 200),
        ProfitOverTime(date: date(2024, 4, 1), profit: 380),
        ProfitOverTime(date: date(2024, 5, 1), profit: 400),
        ProfitOverTime(date: date(2024, 6, 1), profit: 370),
        ProfitOverTime(date: date(2024, 7, 1), profit: 430),
        ProfitOverTime(date: date(2024, 8, 1), profit: 500),
        ProfitOverTime(date: date(2024, 9, 1), profit: 530),
        ProfitOverTime(date: date(2024, 10, 1), profit: 400),
        ProfitOverTime(date: date(2024, 11, 1), profit: 370),
        ProfitOverTime(date: date(2024, 12, 1), profit: 470),
    ]
}

@State var range: (Date, Date)? = nil

public var body: some View {
    VStack {
        Chart(data, id: \.date) {
            LineMark(
                x: .value("Date", $0.date, unit: .month),
                y: .value("Profit", $0.profit)
            )
            .interpolationMethod(.catmullRom)
            .symbol(by: .value("departmentName", "A"))
            if let range = range {
                RectangleMark(
                    xStart: .value("Range Start", range.0),
                    xEnd: .value("Range End", range.1)
                )
                .foregroundStyle(.gray.opacity(0.03))
            }
        }
        .chartOverlay { proxy in
            GeometryReader { geometry in // 座標を取得
                // ドラッグジェスチャーに適応するように構成された長方形のView
                Rectangle().fill(.clear).contentShape(Rectangle())
                    .gesture(
                        DragGesture()
                        .onChanged { value in
                            // plotAreaでドラッグの開始位置と現在の位置のX座標を見つける
                            let startX = value.startLocation.x - geometry[proxy.plotAreaFrame].origin.x
                            let currentX = value.location.x - geometry[proxy.plotAreaFrame].origin.x
                            // 開始と現在のX座標の日付の値を見つける
                            if let startDate: Date = proxy.value(atX: startX),
                                let currentDate: Date = proxy.value(atX: currentX) {
                                // 日付のrangeを渡す
                                range = (startDate, currentDate)
                            }
                        }
                        .onEnded{ _ in
                            range = nil // gestureが終わったらrangeをnilにする
                        }
                    )
            }
        }
        .frame(height: 300)
        ForEach(data, id: \.date) { value in
            if let range = range, value.date > range.0, value.date < range.1 {
                Text(value.date, format: .dateTime)
            }
        }
    }
    .frame(maxHeight: .infinity, alignment: .top)
}
グラフをスクロール可能にする
指定した方向にスクロール可能にする
Chart {
   BarMark(...)
}
.chartScrollableAxes(.horizontal) // スクロールを可能にする
スクロール可能なグラフに表示する範囲を指定する
Chart {
   BarMark(...)
}
.chartScrollableAxes(.horizontal)
.chartXVisibleDomain(length: 10) // 表示範囲を10までにする(X軸が1,2,3,4...となっている場合)
//.chartXVisibleDomain(length: 3600 * 6) // 表示範囲を6時間分にする(X軸が時間の場合)
スクロールの位置をbindingさせる
@State var scrollPosition: Date = Date() // 現在時刻
...
Chart {
   BarMark(...)
}
.chartScrollableAxes(.horizontal)
.chartXVisibleDomain(length: 3600 * 6)
.chartScrollPosition(x: $scrollPosition) // X軸の現在時刻の値までスクロールさせた状態にする
スクロールする位置を調整
chartScrollTargetBehaviorを用いることでスクロール終了時の位置を指定することができる。
以下の例ではスクロール終了時に最も近いX軸のデータのいずれかの位置に調整される
struct SalesData: Identifiable {
    let id = UUID()
    let day: Int
    let sales: Int
}

let salesData: [SalesData] = [
    SalesData(day: 1, sales: 100),
    SalesData(day: 2, sales: 150),
    SalesData(day: 3, sales: 200),
    SalesData(day: 4, sales: 250),
    SalesData(day: 5, sales: 300),
    SalesData(day: 6, sales: 350),
    SalesData(day: 7, sales: 400),
    SalesData(day: 8, sales: 450),
    SalesData(day: 9, sales: 500),
    SalesData(day: 10, sales: 550),
    SalesData(day: 11, sales: 600),
    SalesData(day: 12, sales: 650)
]

var body: some View {
    Chart(salesData) { data in
      LineMark(
         x: .value("Day", data.day),
         y: .value("Sales", data.sales)
      )
    }
    .chartScrollableAxes(.horizontal)
    .chartXVisibleDomain(length: 3)
    .chartScrollTargetBehavior(.valueAligned(unit: 1)) // スクロール終了時にX軸のデータの位置になるように調整する
    .frame(height: 300)
    .padding()
}
Chartのデザイン
WWDC22の以下2つはグラフのデザインについてのセッションで実装する際の参考になる。両方ともコードは一切出てこないので非エンジニアでも見れそう。
おわりに
多分Chartsについてまとめてる記事の中で一番細かいところまで書いてるんじゃないかなと思います。
冒頭でも触れたようにドキュメントの内容全てを網羅してるわけでもないので(現時点で8割ほど)、随時更新します。
また、間違いなどもあると思うのでコメントいただけると助かります。
参考資料
WWDC22
- Hello Swift Charts
- Swift Charts: Raise the bar
- Design an effective chart
- Design app experiences with charts
WWDC23