背景
時系列データの移動平均(running average)や移動標準偏差を計算したい場合で、元のデータと全く同じデータ数で欲しかったり、平均からの差や比などもう少し細かな作業をしたい場合に、python の numpy だけでシンプルに書く方法の紹介です。コードをみればわかるひとは、google Colab のページ を参照ください。
時系列データに単純な移動平均だけをかけるだけなら、もっと楽な方法もあります。
- numpy.convolveメソッドで移動平均
-
SciPy の Savitzky-Golay フィルタ
- 高周波数フィルターをカットし、移動平均よりも元データの形状が残りやすいのが特徴。
Savitzky-Golay フィルタの使い方の例は、
from scipy.signal import savgol_filter
出力 = savgol_filter(入力データ, ウィンドウ数, フィルタ次数, mode="wrap")
となり、とても簡単。ここでは、データが少し癖があったり、微調整を自分で加えたい人向けに、コードの中身が見える形を心がけた例を示します。
コードの説明
入力データ
入力データは、
264945396.378 479.531707317 97.8839998677 1.000976563
264945396.428 439.570731707 93.716794889 1.000976563
264945396.478 579.434146341 107.598219756 1.000976563
264945396.528 539.473170732 103.821660114 1.000976563
264945396.578 702.745098039 118.785601919 0.99609375
....
のように、
| 1 | 2 | 3 | 4 |
|---|---|---|---|
| 絶対時刻(1) | 装置の出力(2) | 装置の誤差(3) | 不感時間の割合(4) |
の書かれている4行のテキストファイルを想定する。
- fits ファイルからアスキーファイルへの変換ツール flc2ascii : https://heasarc.gsfc.nasa.gov/xanadu/xronos/help/flc2ascii.html
を使った場合はこの形式が多いであろう。
サンプルデータは下記から入手可能である。
- 14_23_short_filt.qdp : http://www-x.phys.se.tmu.ac.jp/~syamada/qiita/20171229/14_23_short.qdp
サンプルのテキストをプロットすると、

のように、数万点の時系列データが含まれている。
(このデータは、前半で特徴的なブラックホールからのX線の準周期的な時間変動が見えます。パッと見るだけだと、何か構造があることには気がつかないですよね。)
このような場合に、ある時間幅での移動平均や、標準偏差を計算すると、隠された変動に気がつきやすいので、それを簡単にやる方法の紹介です。
使い方
./filterdata.py ファイル名 フィルターをかけたい時間幅
という使い方である。
標準出力に下記の8つの情報が出される。
| 1 | 2 | 3 | 4 | 5 | 6 | 7 | 8 |
|---|---|---|---|---|---|---|---|
| 絶対時刻(1) | 装置の出力(2) | 装置の誤差(3) | 不感時間の割合(4) | 相対時刻(5) | 標準偏差(6) | 移動平均(7) | (2)-(7) |
結果の例
python ./filterdata.py 14_23_short.qdp 5 > 14_23_short_filt.qdp
として実行した。
gnuplot> plot "14_23_short_filt.qdp" u 5:2 w l, "" u 5:7 w l ti "mean", "" u 5:($6)*3 w l ti "std"
でプロットすると、平滑化のご利益がよく分かる。

5秒で平均を求めることで、揺らぎが抑制されて、平均値の変動の様子がキレイにみてとれる。標準偏差も時間が経つにつれて徐々に減っている。よく見ると、平均値と標準偏差に時間的な相関がある。(ブラックホールの N-sigma relation と呼ばれる現象で、明るくなると変動も大きくなることが知られている。)
サンプルコード
get_detrend_spline という関数に、フィルターの時間幅(dt), 相対的な時間の配列(rtime), 装置の出力(det), 装置のエラー(dete)を入れると、フィルターが計算される。オプションの order で polyfit の次元、usemean で単純な平均値を使うことに変更することもできる。
# !/usr/bin/env python
# -*- coding: utf-8 -*-

"""
Example of filtering time-series data
"""

import numpy as np
import sys

def get_detrend_spline(dt, rtime, det, dete, order = 2, usemean = False):
    """ [input]
        dt: time duration for filtering,
        rtime: time (relative)
        det : detector output
        dete : detector output error
        order : order used for polyfit
        usemean : polynominla is used (Default). When True, np.mean() is used.

        [output] all are filterred on a timescale of dt.
        npstdlong : standard deviation
        npavelong : mean
        detrend_sub : det - mean
        detrend_sube : dete (nothing is done)
        detrend_ratio : det / mean
        detrend_ratioe : dete / mean
    """

    dtlong = dt
    rtime = np.array(rtime)
    det = np.array(det)
    dete = np.array(dete)

    stdlong = []
    avelong = []

    for i, delta in enumerate(rtime):

        if delta > 0 :
            tminlong = delta - dtlong
            tmaxlong = delta + dtlong

            localdetlong = det[np.where( (rtime >= tminlong) & (rtime < tmaxlong) )]
            localrtime = rtime[np.where( (rtime >= tminlong) & (rtime < tmaxlong) )]

            if len(localdetlong) > 0:
                coefficients = np.polyfit(localrtime, localdetlong, order)
                polynomial = np.poly1d(coefficients)
                tmpstdlong = np.std(localdetlong)

                if usemean:
                    tmpavelong = np.mean(localdetlong)
                else:
                    tmpavelong = polynomial(delta)

            else:
#                print("zero found.  t=" + str(delta) +  " t1=" + str(tminlong) + " t2=" + str(tmaxlong) + " r=" + str(det[I]))
                tmpstdlong = 0.
                tmpavelong = 0.

            stdlong.append(tmpstdlong)
            avelong.append(tmpavelong)
        else:
            stdlong.append(0.)
            avelong.append(0.)

    npstdlong = np.array(stdlong)
    npavelong = np.array(avelong)

    detrend_sub = det - npavelong
    detrend_sube = dete
    detrend_ratio = det / npavelong
    detrend_ratioe = dete / npavelong

    print( " len(rtime) = " + str(len(rtime)) )
    print( " len(npavelong) = " + str(len(npavelong)) )
    return (npstdlong, npavelong, detrend_sub, detrend_sube, detrend_ratio, detrend_ratioe)


argvs = sys.argv
argc = len(argvs)

if (argc != 3):
    print ('\n[ERROR] Usage: # python %s inputfile dt \n' % argvs[0] )
    quit()

fname=argvs[1]
dt=float(argvs[2])


file=open(fname,"r")

time = []
rate = []
ratee = []
frac = []

for i, one in enumerate(file):
    one = one.split()
    time.append(float(one[0]))
    rate.append(float(one[1]))
    ratee.append(float(one[2]))
    frac.append(float(one[3]))

time  = np.array(time)
rate  = np.array(rate)
ratee = np.array(ratee)
frac  = np.array(frac)

rtime = []
for t in time:
    rtime.append(t - time[0])

rtime = np.array(rtime)

npstdlong, npavelong, detrend_sub, detrend_sube, detrend_ratio, detrend_ratioe = get_detrend_spline(dt, rtime, rate, ratee, order = 2, usemean = False)

for x1, x2, x3, x4, rt, std, ave, sub in zip(time, rate, ratee, frac, rtime, npstdlong, npavelong, detrend_sub):
    print(x1, x2, x3, x4, rt, std, ave, sub)
入力ファイルのフォーマットや、出力したい値などはケースバイケースでしょうから、適宜変更ください。
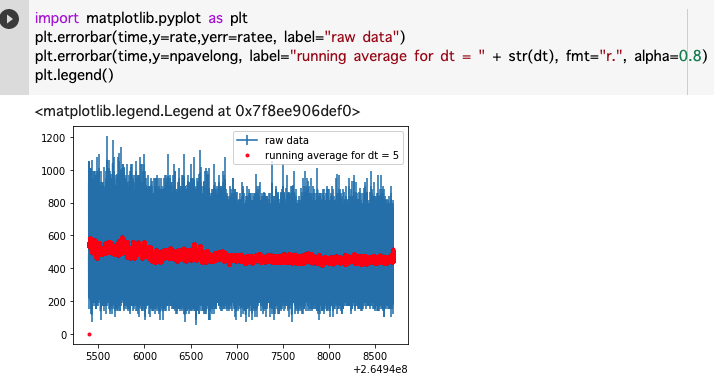
プロットして確認
import matplotlib.pyplot as plt
plt.errorbar(time,y=rate,yerr=ratee, label="raw data")
plt.errorbar(time,y=npavelong, label="running average for dt = " + str(dt), fmt="r.", alpha=0.8)
plt.legend()
などで、プロットしてデータを確認しよう。
詳細は、google Colab のページを参照ください。
少し別の書き方も紹介しておきます
# !/usr/bin/env python
# -*- coding: utf-8 -*-

"""
時系列データのフィルタリング例
"""

import numpy as np
import sys

def get_detrend_spline(dt, rtime, det, dete, order=2, usemean=False):
    """
    与えられた時間幅 dt でフィルタリングを行う

    Parameters
    ----------
    dt : float
        フィルタリングに使う時間幅
    rtime : array_like
        相対時間配列
    det : array_like
        検出器出力
    dete : array_like
        検出器出力の誤差
    order : int, optional
        多項式フィットの次数 (デフォルト: 2)
    usemean : bool, optional
        True の場合は局所平均値を使用し、False の場合は多項式評価値を使用

    Returns
    -------
    npstdlong : ndarray
        標準偏差
    npavelong : ndarray
        平均値
    detrend_sub : ndarray
        det - 平均値
    detrend_sube : ndarray
        dete (そのまま)
    detrend_ratio : ndarray
        det / 平均値
    detrend_ratioe : ndarray
        dete / 平均値
    """
    stdlong, avelong = [], []

    for delta in rtime:
        if delta > 0:
            mask = (rtime >= delta - dt) & (rtime < delta + dt)
            local_det, local_time = det[mask], rtime[mask]

            if local_det.size > 0:
                if usemean:
                    tmp_ave = np.mean(local_det)
                else:
                    coeffs = np.polyfit(local_time, local_det, order)
                    tmp_ave = np.polyval(coeffs, delta)
                tmp_std = np.std(local_det)
            else:
                tmp_std = tmp_ave = 0.0
        else:
            tmp_std = tmp_ave = 0.0

        stdlong.append(tmp_std)
        avelong.append(tmp_ave)

    npavelong = np.array(avelong)
    npstdlong = np.array(stdlong)
    detrend_sub = det - npavelong
    detrend_ratio = det / npavelong
    detrend_sube = dete
    detrend_ratioe = dete / npavelong

    return npstdlong, npavelong, detrend_sub, detrend_sube, detrend_ratio, detrend_ratioe


# ----------- メイン処理 -----------
if len(sys.argv) != 3:
    print(f"\n[ERROR] Usage: python {sys.argv[0]} inputfile dt\n")
    sys.exit(1)

fname, dt = sys.argv[1], float(sys.argv[2])

# データ読み込み
data = np.loadtxt(fname)
time, rate, ratee, frac = data.T  # 列を分割
rtime = time - time[0]  # 相対時間に変換

# フィルタリング処理
npstdlong, npavelong, detrend_sub, detrend_sube, detrend_ratio, detrend_ratioe = get_detrend_spline(
    dt, rtime, rate, ratee, order=2, usemean=False
)

# 結果表示
for values in zip(time, rate, ratee, frac, rtime, npstdlong, npavelong, detrend_sub):
    print(*values)
