はじめに
plotly を用いて、簡単なhtmlを作成したいだけだが、リニアとログの切り替えまではボタンで簡単にできるようにしたい場合に、簡単な例が見つからなかったので紹介してみます。縦軸と横軸の log or linear に変換するためのドロップボックスのボタンを付けたシンプルなな例です。plotlyが動く環境であれば、下記のコードのコピペで動くはず。
概要
最低限の2つの関数を用意した。
- setdata(): 簡単なデータ(x,y)を作成し、それを用いて go.Scatter のリストを作成する。
- writehtml(): setdata()で作成した data を用いて、レイアウトと、dropdownボタンを設定し、html で書き出す。
データを生成し、plotlyのグラフのオブジェクトのリストを生成し、レイアウトやボタンの調整をして、html を書き出す、というだけの機能です。
実装例
python plotly_xydata.py
#!/usr/bin/env python

import plotly.graph_objects as go
import numpy as np

def setdata():
    # fill data
    data = []
    for i in range(5):

        x = np.linspace(1,12,1024)
        y = np.abs(np.exp(-x) * np.sin(i*x) + 1.0) # y = |exp(-x)*sin(nx)+1|

        trace = go.Scatter(
                x=x,
                y=y,
                visible=True,
                line=dict(width=2),
                name=str(i)
                )
        data.append(trace)
    return data

def writehtml(data,htmlname="checkploty.html"):
    # set layout
    layout = go.Layout(title="plotly test",xaxis=dict(title="Time (s)"),yaxis=dict(title="a.u."))
    fig=go.Figure(layout=layout,data=data)
    fig.update_yaxes(type="log")
    fig.update_xaxes(type="log")
    fig.update_yaxes(exponentformat='none')
    fig.update_xaxes(exponentformat='none')

    # add dropdown
    fig.update_layout(
    updatemenus=[
            dict(
                buttons=list([
                        dict(
                            args=[{"xaxis.type": "log"},{"yaxis.type": "log"}],
                            label="xlog-ylog",
                            method="relayout"
                            ),
                        dict(
                            args=[{"xaxis.type": "linear"},{"yaxis.type": "linear"}],
                            label="xlin-ylin",
                            method="relayout"
                            ),
                        dict(
                            args=[{"xaxis.type": "log"},{"yaxis.type": "linear"}],
                            label="xlog-ylin",
                            method="relayout"
                            ),
                        dict(
                            args=[{"xaxis.type": "linear"},{"yaxis.type": "log"}],
                            label="xlin-ylog",
                            method="relayout"
                            ),
                        ]),
            direction="down")
            ])

    # write html
    fig.write_html(htmlname)
    print("[Save]", "save as ", htmlname)

data = setdata()
writehtml(data)
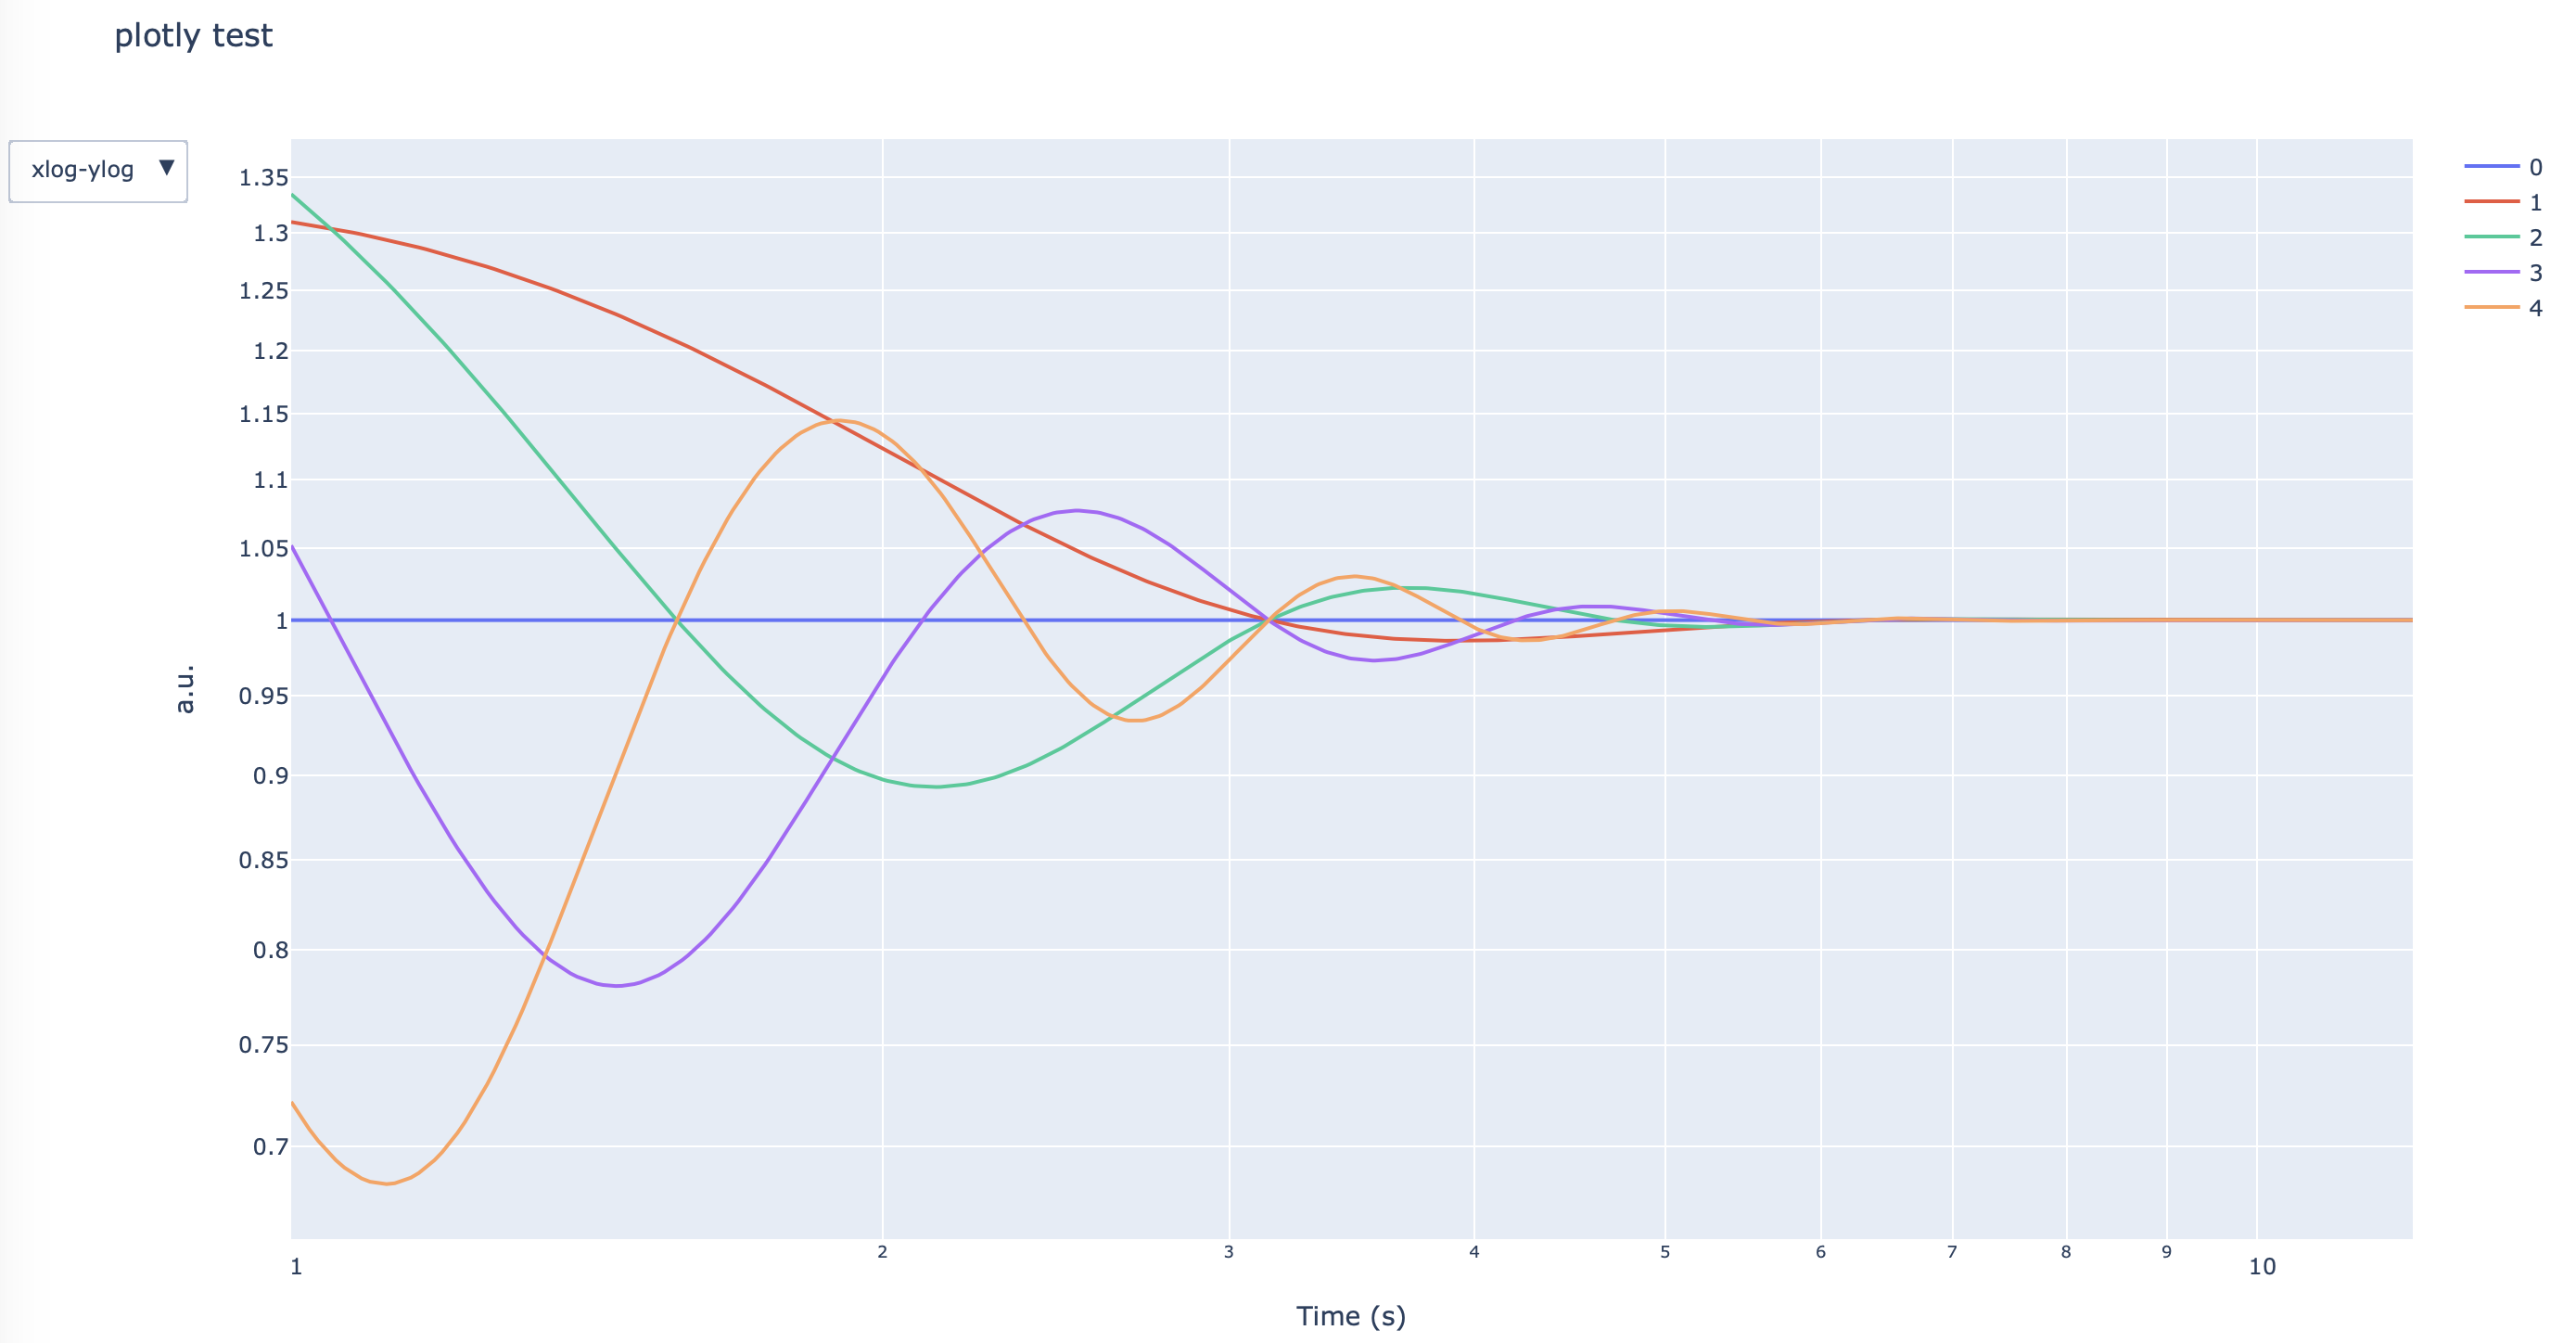
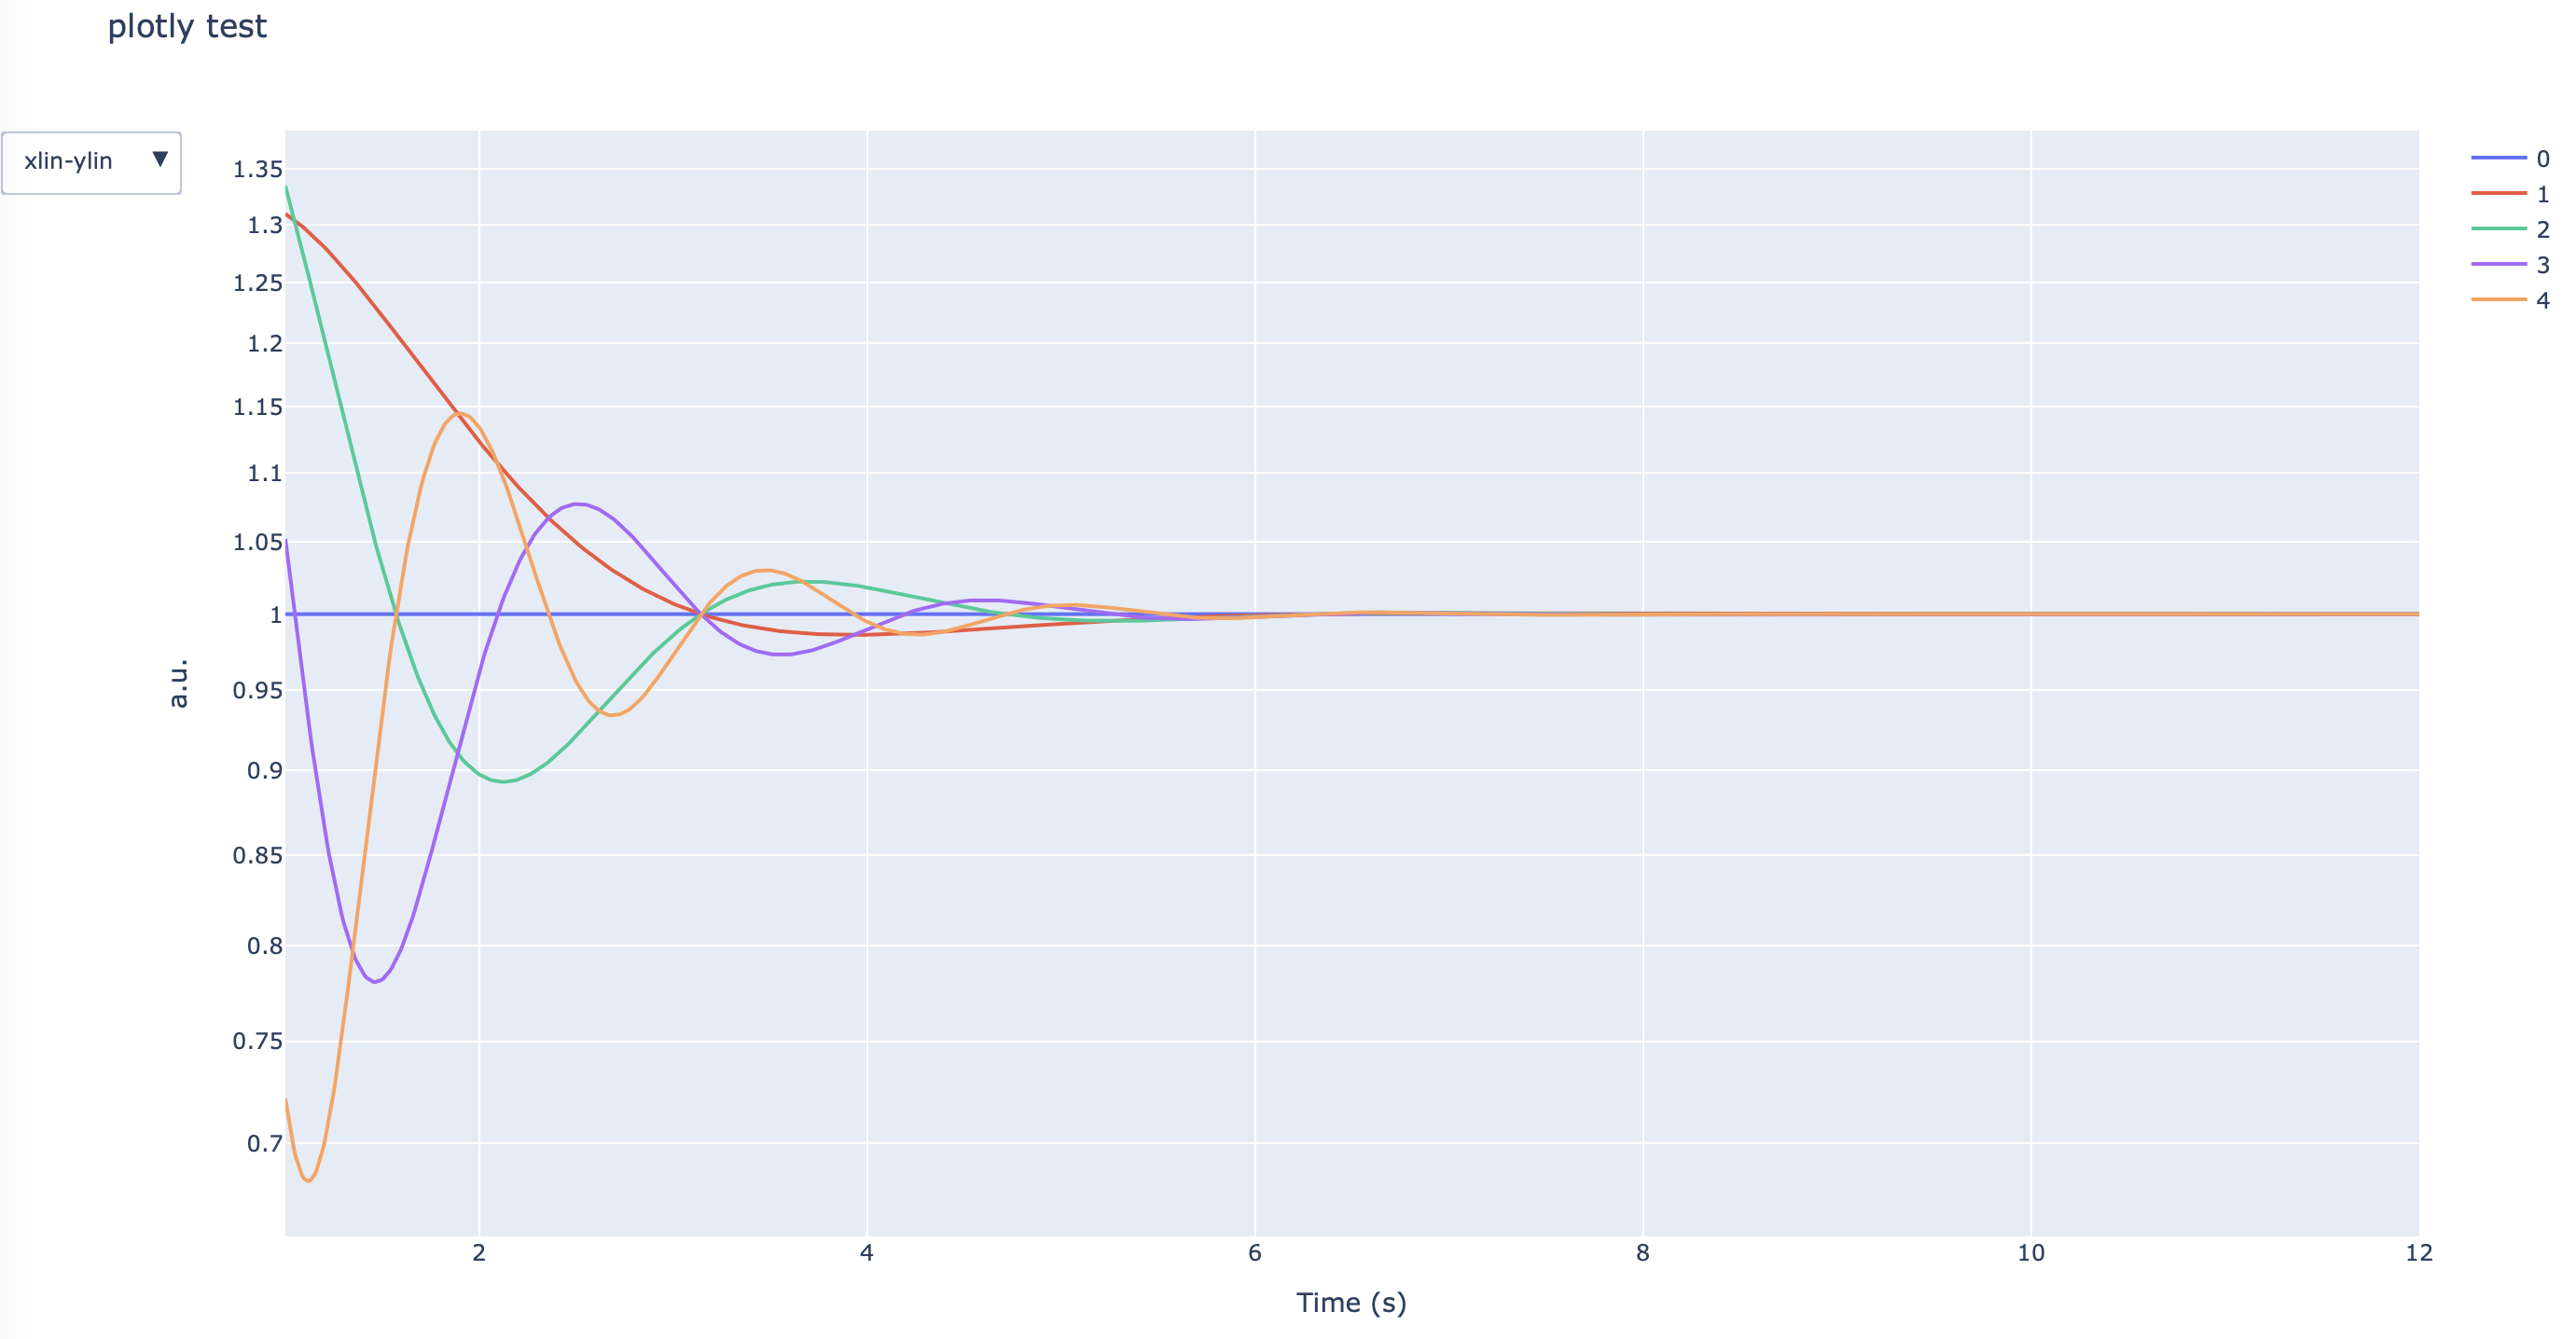
実行例
log-log の例
linear-linear の例
plotly の legend の使い方について
plotly の html は、legend を一回クリックすると、そのデータが見えなくなり、ダブルクリックすると、そのデータ以外は見えなくなります。たくさんデータあっても、クリックすれば取捨選択できるのでとっても便利です。