背景
python で既に構築されているヒストグラムを後からビンまとめしたい場合に、2つのやり方を紹介する。例えば、root を用いて一次元ヒストグラムを生成していて、 uproot でヒストグラムを読んだ場合など、python でビンまとめ(俗称rebin)したい場合に便利かと思います。
googleユーザーで、コードを見ればわかる人は、google colab のサンプルページ を見てください。
具体的な方法
方法1(ビンまとめしたい数で割り切れる場合)
一次元のヒストグラムで、要素数がN個で、これをkビンにまとめたい場合、N/kが割り切れる場合に限定しても構わないことが多いはず。この場合は、numpy.splitで要素数を分割して、その要素毎に平均を計算すればよい。
rebin1.py
import matplotlib.pyplot as plt
import numpy as np

# 正規分布の乱数を2種類生成する。
mean=30; std=6; n=5000
n1 = np.random.normal(mean,std,n)
mean=50; std=6; n=10000
n2 = np.random.normal(mean,std,n)
n12 = np.concatenate([n1, n2])

y, xbin = np.histogram(n12, range=(0,80), bins=100)
x = 0.5*(xbin[1:] + xbin[:-1])

# ビンまとめする関数。rebin にはビンまとめするビン数を入れる。
def rebin(x, y, rebin=2, renorm=False):
   if not len(x) % rebin == 0: print("ERROR : len(x)/rebin was not an integer."); return -1, -1
   ndiv = int(len(x)/rebin)
   xdiv = np.split(x, ndiv)
   ydiv = np.split(y, ndiv)
   xd = np.mean(xdiv, axis=1) # mean of bins
   yd = np.sum(ydiv, axis=1) # sum of entries
   if renorm: yd = yd/rebin
   return xd, yd

xd, yd = rebin(x, y, rebin=4, renorm=True)

fig, ax = plt.subplots(figsize=(10.0, 6.0))
plt.subplot(121)
plt.plot(x,y+1,"ko-", label="no rebin")
plt.plot(xd, yd+1, "ro-", label="rebin 4, renorm=True")
print(xd.shape)
plt.yscale("linear")
plt.ylabel("counts/bin + 1")
plt.xlabel("xvalue")
plt.legend()
#
plt.subplot(122)
plt.plot(x,y+1,"ko-", label="no rebin")
plt.plot(xd, yd+1, "ro-", label="rebin 4, renorm=True")
print(xd.shape)
plt.yscale("log")
plt.ylabel("counts/bin + 1")
plt.xlabel("xvalue")
plt.legend()
plt.show()
- 2つのガウス分布を足し込みで、サンプルデータを生成しています。
- np.splitで分割して、X軸方向はmeanで、縦軸方向はsumで計算
- renormフラグのON/OFFで、rebin数で割るか、割らないかを調節できる。(全面積を保存したいか、縦軸をcounts/binにして、bin幅を広くしても、縦軸が同じ場所に来るように表示したいかどうか、という違いです。)
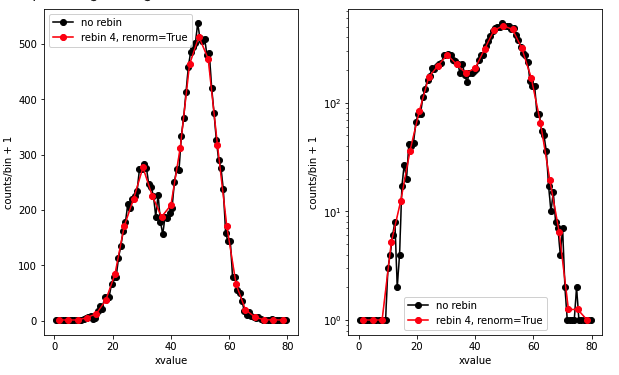
(左)縦軸がリニア、(右)縦軸がログで、ログ表示するために縦軸方向に1を足して表示してます。
方法2(ビンまとめしたい数で割り切れない場合でも可)
2つ目の方法は、np.convolveで、全要素1のベクトルとの畳み込みを計算する方法である。
rebin2.py
import matplotlib.pyplot as plt
import numpy as np

# 正規分布の乱数を2種類生成する。
mean=30; std=6; n=5000
n1 = np.random.normal(mean,std,n)
mean=50; std=6; n=10000
n2 = np.random.normal(mean,std,n)
n12 = np.concatenate([n1, n2])

y, xbin = np.histogram(n12, range=(0,80), bins=100)
x = 0.5*(xbin[1:] + xbin[:-1])

# ビンまとめする関数 (np.convolve編)
def rebinc(x, y, rebin=2, renorm=False, cut=True):
   if not len(x) % rebin == 0: print("Warning : len(x)/rebin was not an integer.")
   v = np.ones(rebin)
   if renorm: v = v/rebin
   xd = np.convolve(x,v, mode='valid')
   yd = np.convolve(y,v, mode='valid')
   if cut: xd = xd[::rebin]; yd = yd[::rebin];
   return xd, yd

xd1, yd1 = rebinc(x, y, rebin=4, renorm=True, cut=True)

fig, ax = plt.subplots(figsize=(10.0, 6.0))
plt.subplot(121)
plt.plot(x,y+1,"ko-", label="no rebin", alpha=0.5)
plt.plot(xd1, yd1+1, "ro-", label="rebin 4, cut = True", alpha=0.8)
print(xd1.shape)
xd2, yd2 = rebinc(x, y, rebin=4, renorm=True, cut=False)
print(xd2.shape)
plt.plot(xd2, yd2+1, "b.-", label="rebin 4, cut = False",alpha=0.6)
plt.yscale("linear")
plt.ylabel("counts/bin + 1")
plt.xlabel("xvalue")
plt.legend()
#
plt.subplot(122)
plt.plot(x,y+1,"ko-", label="no rebin", alpha=0.5)
plt.plot(xd1, yd1+1, "ro-", label="rebin 4, cut = True", alpha=0.8)
print(xd1.shape)
xd2, yd2 = rebinc(x, y, rebin=4, renorm=True, cut=False)
print(xd2.shape)
plt.plot(xd2, yd2+1, "b.-", label="rebin 4, cut = False", alpha=0.6)
plt.yscale("log")
plt.ylabel("counts/bin + 1")
plt.xlabel("xvalue")
plt.legend()
plt.show()
- サンプルデータはガウス分布を2つ足したもの
- np.convolveで、要素1のベクトルをx, y 軸それぞれで畳み込む。
- renorm フラグで、rebin数で割るかどうかを変更できる。
- cut フラグで、要素数をrebin数で間引くか、間引かない(running averegeに相当)か、変更できる。
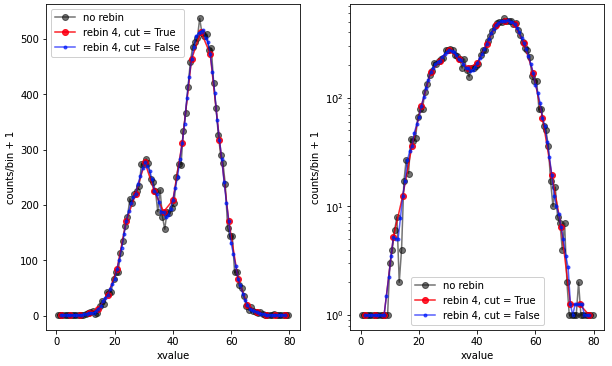
どれも概形は変化せず、平滑化が行われていることがわかる。縦軸をログ表示して、イベント数が少ない部分で計算が問題ないことを示すために、縦軸に1を加えて表示している。
結論
pythonで、1次元ヒストグラムをrebinしたい場合は、要素数を割り切れる数でsplitして平均するか、np.convolveで畳み込みで平滑化するか、2つの方法があって、好きな方法で間違えないように使いましょう。特に、全面積が保存することが大事な場合は、rebin前後での全積分の値をチェックすると大間違いは避けられると思います。