はじめに
python を用いて複数個の peak を自動検出について方法だけでなく、その原理も含めて解説してみます。
まず、python で、複数個の peak を自動検出する方法の代表格は、
- find_peaks 同値ピークが存在する場合でも正しくピーク検出できる。
- argrelmax 単独の極大値を返す。(同値のピークがある場合は取り逃がす)
- argrelmin 単独の極小値を探す。(同値のピークがある場合は取り逃がす。)
- argrelextrema 任意の判定条件を用いて、極値が判定できる。
の4つの関数で、この中から目的に合致するものをチョイスすることが多いです。
これらの使い方を解説をした記事は色々と出てますので、そちらを参考ください。
ここでは、そもそもどういうパラメータがあって、どういう原理を使ってピークを捉えるのがよいか、について少し説明をしつつ、scipy の中ではどう実装されているかについて解説したいと思います。
複数個のピーク検出の原理について
複数個のピークとは何か?
まずは、ピークは何かを定義しないと、話が噛み合いませんので、この記事ではピークの定義から考えます。実用例から考えてみますと、ピークを検出する必要があるのは、一次元の光のスペクトルの中の輝線や吸収線を見つけたい場合、FFTした周波数信号の共振ピークを見つけたい場合、時系列データの山や谷を捉えたい場合など、でしょうか。この記事ではそのようなピークの検出を想定しています。
これを、コンピュータが解釈できる言葉にすると、ある局所的な範囲において、データが単調に増加し、単調に減少する、その節目のことをピークと呼んでいると思います。数学的には、微係数がゼロ、つまり極大値、極小値を求めるアルゴリズムがあればよいことになります。もしデータが連続的であれば、数学的には必ず微係数がゼロ点がどこかにあるはずですが、現実のコンピュータの世界は離散的にしか数字を扱えないので、ゼロではなく、微係数の符号が変わる点を探すことになります。
つまり、ピークとは、微係数の符号が変わる点を探せばよい、というわけで、もしそれだけで十分な状況であれば、np.diff で微分して符号を調べるだけでよいです。
ピークの特徴量
現実的にはもう少し細かくピークを弁別したい状況が多いと思います。ピークが何個もある場合や、見誤りやすいノイズが含まれてる場合など、そう言う場合には、ピークの特徴量を使います。
ピークを特徴付ける量は、
- ピークの高さ
- ピークの位置
- ピークの幅、非対称度
- 一つのピークと前後のピークの間隔
があります。これらを用いて、ピークの選別をします。find_peaks には、あらかじめ用意された選別条件が書かれていて、それについては後述します。ピークの検出さえ正しくできれば、カット条件は自分でコーディングするというスタンスもありかと思います。
ピーク判定後の処理ではなくて、前処理として、低周波や高周波成分を落としたり、サンプリングレートを変える、フィルタの種類を変えるなど、特徴量は前処理にも強く依存しますので、自分のみたい "ピーク" のスケールは環境に合わせたカスタマイズが必要になることが多いかと思います。
差分の符号だけ使った簡単なピーク検出
まずは、もっとも基本の型となる、差分を用いたピーク検出法から紹介します。
に、sin と 対数正規分布の場合の例を紹介しました。
最後の極大値を取得するフィルター生成が肝で、これ図示すると次のような感じです。
差分をとって、1つずらして、それと掛け算で符号を見ると、極値のところだけ符号が変わる。さらに、極大値と極小値を弁別するために、差分の正負で場合分けをする。
sin の場合
import numpy as np
import matplotlib.pyplot as plt

# sin 関数の場合
smin, smax, slen = 0, 15, 100
x = np.linspace(smin, smax, slen)
s = np.sin(x)
plt.plot(x,s,"o")
plt.show()

sdiff = np.diff(s) # 差分を取る。(要素数が1つ減る)

# 極大値のみを取得 : (差分 x 1つシフトした差分が負) & (差分が正)、という条件
sdiff_sign = ((sdiff[:-1] * sdiff[1:]) < 0) & (sdiff[:-1] > 0)

plt.plot(x, s, label="sin curve")
plt.plot(x[1:-1][sdiff_sign], s[1:-1][sdiff_sign],"o",label="peak")
plt.legend()
plt.show()
対数正規分布の場合
を参考に、対数正規分布に従う乱数を生成しています。
rng = np.random.default_rng()
mu, sigma, nsample, nbins =3., 0.1, 500, 100
s = rng.lognormal(mu, sigma, int(nsample))

# 対数正規分布で生成した乱数のヒストグラムを表示
count, bins, ignored = plt.hist(s, bins = nbins, density=True, align='mid')

# 生成に用いた対数正規分布のグラフをプロットする
x = np.linspace(min(bins), max(bins), 10000)
pdf = (np.exp(-(np.log(x) - mu)**2 / (2 * sigma**2)) / (x * sigma * np.sqrt(2 * np.pi)))
plt.plot(x, pdf, linewidth=2, color='r')
plt.yscale("log")
plt.axis('tight')
plt.show() # ヒストグラムで、対数正規分布の生成を確認

x = np.arange(len(s))
sdiff = np.diff(s)
sdiff_sign = ((sdiff[:-1] * sdiff[1:]) < 0) & (sdiff[:-1] > 0)
plt.plot(x, s, label="log-normal curve")
plt.plot(x[1:-1][sdiff_sign], s[1:-1][sdiff_sign],"o",label="peak")
plt.legend()
plt.show() # peak判定の結果を確認
生成した対数正規分布のヒストグラムと、極大値の判定結果です。
簡単なピークサーチの落とし穴
実は、この差分を使うピークサーチは簡単なようで、1つ落とし穴がある。実は、同じ値が連続した時に判定されないのである。それを図説したのがこちら。
差分は、全く同じ値が連続してしまうと、0 になってしまう。0 は、どんな有限な値との掛け算でも 0 になってしまうので、判定の時に漏れてしまう。0 を正しく扱うには、区別がつかない代物なので、特別扱いしないといけない。
極大値に同値がある場合の差分によるピーク検出の例
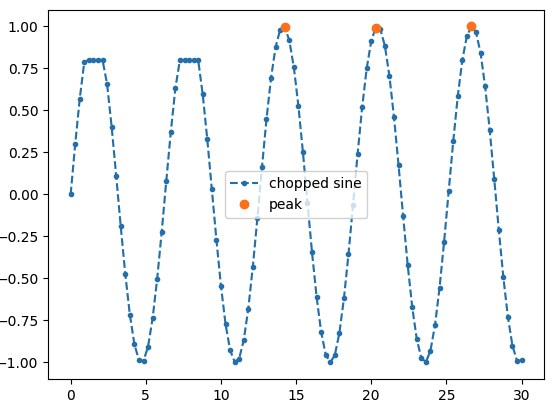
実際に、sin波の一部をちょんぎった場合の例がこちら。
smin, smax, slen = 0, 30, 100
x = np.linspace(smin, smax, slen)
s = np.sin(x)
s[(s>0.8) & (x<10)] = 0.8
sdiff = np.diff(s)
sdiff_sign = ((sdiff[:-1] * sdiff[1:]) < 0) & (sdiff[:-1] > 0)
plt.plot(x, s, ".--", label="chopped sine")
plt.plot(x[1:-1][sdiff_sign], s[1:-1][sdiff_sign],"o",label="peak")
plt.legend()
plt.show()
scipy の実装例
argrelmax などの差分タイプ
argrelmax の御本尊にあたる部分は、_boolrelextrema という関数を用いている。
それとほぼ同等なコードがこちらに書きくだしたものです。
# argrelmax の御本尊の関数を使う
def _boolrelextrema_local(data, comparator, axis=0, order=1, mode='clip', debug=True):
# using def _boolrelextrema
# https://github.com/scipy/scipy/blob/c1ed5ece8ffbf05356a22a8106affcd11bd3aee0/scipy/signal/_peak_finding.py#L22
  datalen = data.shape[axis]
  locs = np.arange(0, datalen)
  results = np.ones(data.shape, dtype=bool)
  main = data.take(locs, axis=axis, mode=mode)

  for shift in range(1, order + 1):
    if debug: print("shift = ", shift)
    plus = data.take(locs + shift, axis=axis, mode=mode)
    minus = data.take(locs - shift, axis=axis, mode=mode)
    results &= comparator(main, plus)
    results &= comparator(main, minus)
    if debug:
      print("plus = ", plus)
      print("minus = ", minus)
      print("res1 = ", results)
      print("res2 = ", results)
    if ~results.any(): # 全部 False になったら更新はないので、ループから抜ける。
      return results
  return results
- データを同じサイズの results という True/False を詰める配列を用意して、numpy.take で配列をシフトし、その時に mode=clipなので、はみ出たアクセスは先頭と最後の値を詰めるだけ。
- comparetor としては、numpy.greater などの比較演算子を入れることで、True/Falseを更新し、results &= comparator(main,plus) などで、新しい比較結果との AND で更新していく。
- 最後まで True が連続し続けたら True が残り、一度でも False がでると False になるので、results 全てが False になると for loop が終了する。
という感じで、配列をグルグル回して、True/Falseの配列に AND 演算を重ねて更新していく、というスタンスです。
# argrelmax と _boolrelextrema でピーク判定してみる。
smin, smax, slen = 0, 30, 100
x = np.linspace(smin, smax, slen)
data = np.sin(x)
data[(data>0.7) & (x<10)] = 0.7
comparator=np.greater
axis=0
order=5
mode='clip'
debug=False

id1 = argrelmax(data, axis=axis, order=order, mode=mode)
id2 = argrelextrema(data, comparator, axis=axis, order=order, mode=mode)
id3 = _boolrelextrema_local(data, comparator, axis=axis, order=order, mode=mode, debug=debug)

plt.figure(figsize=(5,3))
plt.plot(x, data, ".--", label="chopped sine")
plt.plot(x[id1], data[id1],"o", label="peak using argrelmax")
plt.plot(x[id2], data[id2],"x", label="peak using argrelextrema")
plt.plot(x[id3], data[id3],",", label="peak using boolrelextrema")


plt.legend(loc="lower right")
plt.show()
scipy の argrelmax、argrelextrema と、上で自前で定義した _boolrelextrema_local を用いてピーク判定したものはこちらです。
結果は同じで、どれもピークが同値の場合は判定されない。
find_peaks を用いた場合
scipy の find_peaks を用いると、plateau_size=1 を指定すると、プラトー (同値のピーク) の サイズと、左端と右端の配列を返してくれるので、この配列を用いれば、事後処理でプラトーの条件によりイベント弁別ができる。
# argrelmax と _boolrelextrema でピーク判定してみる。
smin, smax, slen = 0, 30, 100
x = np.linspace(smin, smax, slen)
data = np.sin(x)
data[(data>0.7) & (x<10)] = 0.7

# from scipy.signal import argrelmax
peaks_plateau1, properties_plateau1 = find_peaks(data, plateau_size=1)
peaks_plateau2, properties_plateau2 = find_peaks(data, plateau_size=2)
peaks_plateau10, properties_plateau10 = find_peaks(data, plateau_size=10)

plt.figure(figsize=(5,3))
plt.plot(x, data, ".--", label="chopped sine")
plt.plot(x[peaks_plateau1], data[peaks_plateau1],"x",label="peak using find_peaks plateau_size=1")
plt.legend(loc="lower right")
print(properties_plateau1)
plt.show()

plt.figure(figsize=(5,3))
plt.plot(x, data, ".--", label="chopped sine")
plt.plot(x[peaks_plateau2], data[peaks_plateau2],"x",label="peak using find_peaks plateau_size=2")
plt.legend(loc="lower right")
print(properties_plateau2)
plt.show()

plt.figure(figsize=(5,3))
plt.plot(x, data, ".--", label="chopped sine")
plt.plot(x[peaks_plateau10], data[peaks_plateau10],"x",label="peak using find_peaks plateau_size=10")
plt.legend(loc="lower right")
print(properties_plateau10)
plt.show()
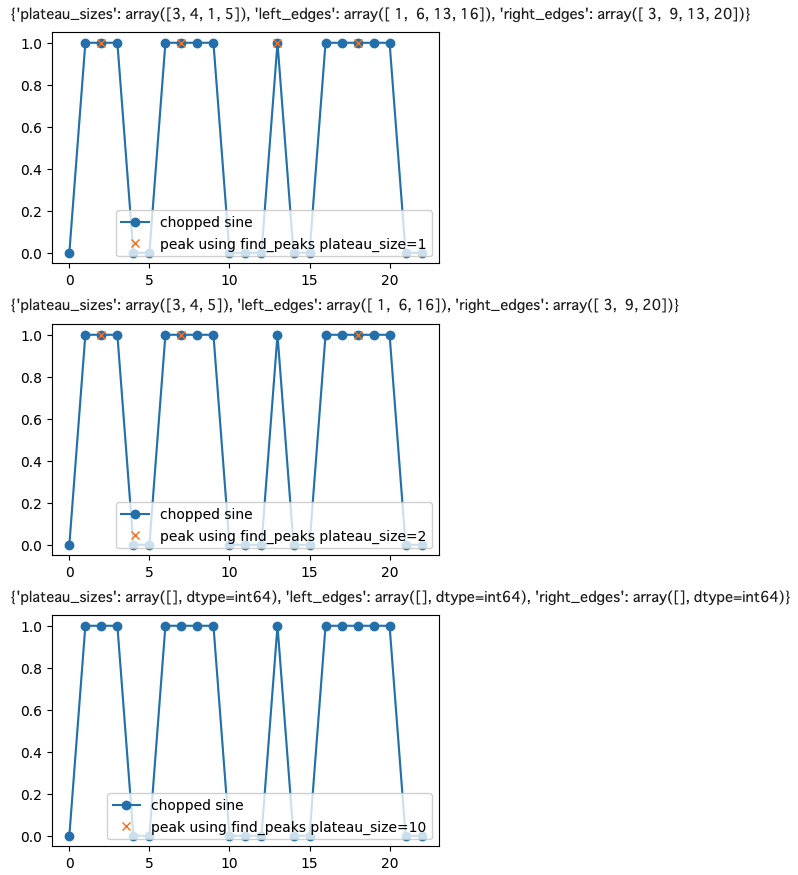
プラートが偶数個のデータ点の場合
プラトーが偶数個ある場合はどうなるでしょうか? それを実際に見てみましょう。
# argrelmax と _boolrelextrema でピーク判定してみる。
data = np.array([0,1,1,1,0,0,1,1,1,1,0,0,0,1,0,0,1,1,1,1,1,0,0])
x = np.arange(len(data))

# from scipy.signal import argrelmax
peaks_plateau1, properties_plateau1 = find_peaks(data, plateau_size=1)
peaks_plateau2, properties_plateau2 = find_peaks(data, plateau_size=2)
peaks_plateau10, properties_plateau10 = find_peaks(data, plateau_size=10)

plt.figure(figsize=(5,3))
plt.plot(x, data, "o-", label="chopped sine")
plt.plot(x[peaks_plateau1], data[peaks_plateau1],"x",label="peak using find_peaks plateau_size=1")
plt.legend(loc="lower right")
print(properties_plateau1)
plt.show()

plt.figure(figsize=(5,3))
plt.plot(x, data, "o-", label="chopped sine")
plt.plot(x[peaks_plateau2], data[peaks_plateau2],"x",label="peak using find_peaks plateau_size=2")
plt.legend(loc="lower right")
print(properties_plateau2)
plt.show()

plt.figure(figsize=(5,3))
plt.plot(x, data, "o-", label="chopped sine")
plt.plot(x[peaks_plateau10], data[peaks_plateau10],"x",label="peak using find_peaks plateau_size=10")
plt.legend(loc="lower right")
print(properties_plateau10)
plt.show()
これを実行した結果が、
となりますが、偶数個の場合は、前の方のデータ点をピークとして選んでいることがわかります。
find_peaks の中身の詳細
find_peaks の _peak_finding.py はインターフェースだけで、実体は、高速化のために、
の中で cython で実装された _local_maxima_1d が御本尊である。cython については、
などを参照ください。
def _local_maxima_1d(const np.float64_t[::1] x not None): の中で、for loop でグルグ回して、極大を探して、極大値が同じなら、ピークの左端(left_edges)と右端(right_edges)を計算する、ということをやってます。計算のメイン部分はこちらで、
def _local_maxima_1d(const np.float64_t[::1] x not None):
    """
    Find local maxima in a 1D array.
    This function finds all local maxima in a 1D array and returns the indices
    for their edges and midpoints (rounded down for even plateau sizes).
    """
    #(省略)
    with nogil:
        i = 1  # Pointer to current sample, first one can't be maxima
        i_max = x.shape[0] - 1  # Last sample can't be maxima
        while i < i_max:
            # Test if previous sample is smaller
            if x[i - 1] < x[i]:
                i_ahead = i + 1  # Index to look ahead of current sample

                # Find next sample that is unequal to x[i]
                while i_ahead < i_max and x[i_ahead] == x[i]:
                    i_ahead += 1

                # Maxima is found if next unequal sample is smaller than x[i]
                if x[i_ahead] < x[i]:
                    left_edges[m] = i
                    right_edges[m] = i_ahead - 1
                    midpoints[m] = (left_edges[m] + right_edges[m]) // 2
                    m += 1
                    # Skip samples that can't be maximum
                    i = i_ahead
            i += 1
その中で、ピークの値(midpionts)は、
midpoints[m] = (left_edges[m] + right_edges[m]) // 2
で、 left_edges と right_edges の中間を //2 で求めていますが、奇数の場合は //2 は切り捨てなので、e.g., 7//2 = 3 となります。
find_peaks のパラメータの調整
より細かなピークの判定においては、find_peaks のオプションのパラメータについても調整が必要となります。
# 対数正規分布の生成
# https://www.headboost.jp/generator-lognormal/ を参考に、対数正規分布に従う乱数を生成する。
rng = np.random.default_rng()
mu, sigma, nsample =1., 0.5, 1e5
signal = rng.lognormal(mu, sigma, int(nsample))

time = np.arange(len(signal))
plt.plot(time, signal, label="log-normal curve")
plt.legend()
plt.show()

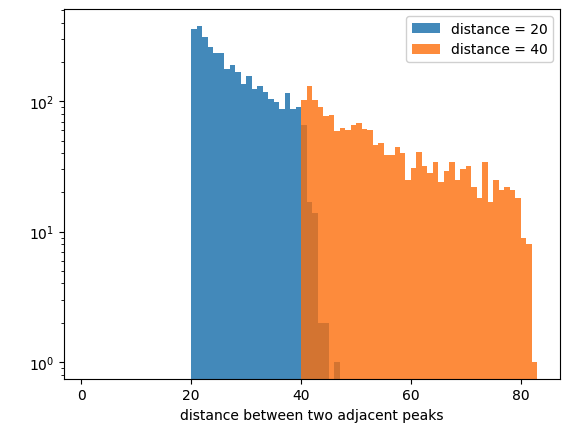
distance=20
peaktime_list_d20, plateau_list_d20 = find_peaks(signal, plateau_size=1, distance = distance)
distance=40
peaktime_list_d40, plateau_list_d40 = find_peaks(signal, plateau_size=1, distance = distance)
print("plateau_sizes = ", set(plateau_list["plateau_sizes"])) # check plateau_sizes to know the number of the flat peaks

diff_peaktime_list_d20 = np.diff(peaktime_list_d20)
diff_peaktime_list_d40 = np.diff(peaktime_list_d40)
w=1
print(plt.hist(diff_peaktime_list_d20, bins=np.arange(1, max(diff_peaktime_list_d40) + w, w), label = "distance = 20", alpha=0.8))
print(plt.hist(diff_peaktime_list_d40, bins=np.arange(1, max(diff_peaktime_list_d40) + w, w), label = "distance = 40", alpha=0.8))
plt.legend()
plt.yscale("log")
plt.xlabel("distance between two adjacent peaks")
この結果は、
のように、discance の違い、ここでは、20, 40 の違いにより、ピークの時間差の分布が異なることがわかる。
ピークの分布についても、
w=0.4
print(plt.hist(signal[peaktime_list_d20], bins=np.arange(1, max(signal[peaktime_list_d40]) + w, w), label = "distance = 20", alpha=0.6))
print(plt.hist(signal[peaktime_list_d40], bins=np.arange(1, max(signal[peaktime_list_d40]) + w, w), label = "distance = 40", alpha=0.6))
plt.legend()
plt.yscale("log")
plt.xlabel("peaks of signals")
のように、cut 条件によって、ピークの分布が異なる。この場合は、discance 20 だと小さいピークをたくさん引っ掛けていることがわかる。
この他にも、
- height
- ピークの高さの絶対値の判定基準
- threshold
- ピークの高さの判定条件だが、height と異なり、隣のピークに比べてどのくらい高いか、という基準。
- distance
- 2つの連続するピークからの距離
- prominence
- wlen でピークの周囲の探索幅を指定し、その幅内で、ピークの左右の最小値を探す max(left_min, right_min)
- prominences は、ピークの左右の最小値の大きい方との差で定義される
- prominences[peak_nr] = x[peak] - max(left_min, right_min)
- https://github.com/scipy/scipy/blob/v1.10.1/scipy/signal/_peak_finding_utils.pyx
- width
- ピークの高さを、peak - prominences x rel_heigth で定義する。
- height = width_heights[p] = x[peak] - prominences[p] * rel_height
- この高さまで、信号が下がる幅を計算する。
- ある window 範囲内で幅が計算できなければ、直線で補完して幅を定義する。
- https://github.com/scipy/scipy/blob/v1.10.1/scipy/signal/_peak_finding_utils.pyx
- ピークの高さを、peak - prominences x rel_heigth で定義する。
- wlen
- peaks prominences を計算するための幅
- rel_height
- peaks width を計算するための相対的な高さ
- plateau_size
- 連続したピークの数
などの条件があるので、問題に応じてこれらのオプションを適切に使うか、自分でオフラインで処理をするとよいです。
【応用編】 ピークの集積方法
応用例として、ピークを集積する方法を紹介します。 find_peaks でピークを検出して、そのピークを stacking して平均的なプロファイルを取得する方法です。
対数正規分布の時系列データの生成
サンプルとして、対数正規分布の時系列データを用意します。
# https://www.headboost.jp/generator-lognormal/ を参考に、対数正規分布に従う乱数を生成する。
rng = np.random.default_rng()
mu, sigma, nsample =3., 2, 8192
signal = rng.lognormal(mu, sigma, int(nsample))

time = np.arange(len(signal))
plt.plot(time, signal, label="log-normal curve")
plt.legend()
plt.show()
など、お好みのパラメータと長さで用意します。
ピークの検出
peak の 判定を行い、ピークを ID できるように peaktime_list というピークの場所が詰まった配列を find_peaks で取得します。
同時ピークの扱いに備えて、plateau_size=1 というオプションで find_peaks を実行しておきます。こうすることで、set(plateau_list["plateau_sizes"]) で、"plateau_sizes" が 1 のみであれば、すべて peak が一点のみだとわかります。 それ以外であれば、複数の同時ピークが存在しうるので、問題に応じて取捨選択を考えましょう。
d = 20
peaktime_list, plateau_list = find_peaks(signal, plateau_size=1, distance=20)
print("plateau_sizes = ", set(plateau_list["plateau_sizes"])) # check plateau_sizes to know the number of the flat peaks
ここでは、distance = 20 とした。このようなパラメータに依存することには注意して解析しましょう。
ピーク前後のデータを集積する
ピークの前後 +/- order 個のデータを切り出して、足しこみます。
np.take(signal, np.arange(peaktime-order,peaktime+order+1)) で、ピークの前後を切り出して、それを append して追加していきます。time の方は、offset (time[peaktime]のこと)を引いておくことで、peaktime を offset にした切り出しになります。
times_list, peaks_list,  = [], []
order = 20 # change as you like
debug = False
for i, peaktime in enumerate(peaktime_list):

  # check out of range
  if ((peaktime - order) < 0) or ((peaktime + (order + 1)) > len(peaktime_list)): # skip when the range is out of input the array
    continue

  # get signal array
  stmp = np.take(signal, np.arange(peaktime-order,peaktime+order+1))
  peaks_list.append(stmp)

  # get time array from the peaktime
  ttmp = np.take(time, np.arange(peaktime-order,peaktime+order+1)) - time[peaktime]
  times_list.append(ttmp)

  # plot if needed to check
  if debug:
    plt.plot(times_list[-1], peaks_list[-1],"o")
    plt.legend()
    plt.show()

times_list = np.array(times_list)
peaks_list = np.array(peaks_list)
np.arange(peaktime - order, peaktime + order + 1) で、 order が偶数の場合は、奇数個のサンプルの取得になる。 e.g.,
In [7]: np.arange(100-2,100+2+1)
Out[7]: array([ 98, 99, 100, 101, 102])
となります。
集積したピークのプロットと平均プロファイルの作成
最後に、np.mean で切り出したピーク近傍の配列を平均化します。
# plot every profile to check (<100)
for i, (onet, onep) in enumerate(zip(times_list, peaks_list)):
  if i < 100:
    plt.plot(onet, onep + i, ".-") # plot every profile with offset i
plt.show()
このように、100個分の profile を表示した例ですが、変なデータ混じっていないか、データをよく見ておきましょう。
OKそうであれば、平均化をしてみましょう。
# 時間の平均 (全部同じなので平均は不要なはず)
folded_time = np.mean(times_list, axis=0)
# ピークの平均化
folded_peak = np.mean(peaks_list, axis=0)

# プロファイルのプロット (ブラックホール連星の解析では、shot profile と呼ばれるもの。)
plt.plot(folded_time, folded_peak, "o-")
plt.show()
これで生成された図が、
で、これが対数正規分布の時系列データのピークの頭を揃えて、足し込んだプロファイルになります。BH連星のデータ解析では shot profile などと呼ばれるものです。
参考文献
手前味噌ですが、、BH連星 Cyg X-1 へのショット解析を使った例は、こういうのがあります。


