この記事の概要
今回のPythonスクリプトでは、XRISM/Resolveで利用される**DS9 region file **を生成するPythonプログラムを解説します。そのついでに、python初学者向けに、matplotlibを用いた可視化や、argparseの使い方についても説明します。
- XRISM/Resolveのregionファイルとは何か
- DS9 region file の自動生成方法
-
matplotlibを使った可視化方法 -
argparseを使ったコマンドライン引数処理の実装例
コードはこちらから取得できます。
1. 必要な情報
XRISM衛星Resolve検出器は、6x6画素の極低温半導体マイクロカロリメータです。
などから、基礎情報をお持ちであることが前提の記事になります。
2. スクリプトの全体構造
このスクリプトは以下の3つの機能を持っています:
- region ファイル生成: 指定したピクセル番号に基づき、DS9用の region file を生成する
- region file解析: 生成されたregionファイルから座標を抽出する
-
plot: 解析した結果を
matplotlibを使って可視化する
3. コードの解説
ピクセルマッピングの定義
DETX, DETY という検出器座標を用います。
pixel_fromdetxdety = [
    [12, 11,  9, 19, 21, 23],
    [14, 13, 10, 20, 22, 24],
    [16, 15, 17, 18, 25, 26],
    [ 8,  7,  0, 35, 33, 34],
    [ 6,  4,  2, 28, 31, 32],
    [ 5,  3,  1, 27, 29, 30]
]
-
6×6のピクセルマトリクスを定義し、
detxとdetyの座標からピクセル番号を取得できるようにしています。これは、DS9やその他のプログラムでも必要となる座標の基礎情報です。
1. Region ファイル生成関数
def generate_region_file(pixels: str, name: str):
    pixel_list = [int(p) for p in pixels.split(",")]
    box_lines = []

    for one_detx in np.arange(1, 7):
        for one_dety in np.arange(1, 7):
            pixel = pixel_fromdetxdety[one_detx - 1][one_dety - 1]
            if pixel in pixel_list:
                box_lines.append(f"+box({one_detx},{one_dety},1,1)")

    filename = f"{name}.reg"

    with open(filename, 'w') as fout:
        fout.write("physical\n")
        fout.write("\n".join(box_lines))

    print(f"Generated: {filename}")
    return filename
解説:
- 指定されたピクセル番号を受け取り、該当する
detxとdetyの座標にボックスを作成します。 - DS9用リージョンファイルは
.reg拡張子で保存されます。 -
physical\nで始まり、ピクセルごとに+box(detx, dety, width, height)の形式でリージョンを定義します。
2. Regionファイル解析と可視化
def parse_and_plot_region_file(filepath, show=False):
    x_coords, y_coords = [], []

    with open(filepath, 'r') as fin:
        lines = fin.readlines()

    for line in lines[1:]:
        if line.startswith("+box"):
            _, coord_str = line.strip().split('(')
            detx, dety, _, _ = map(int, coord_str[:-1].split(','))
            x_coords.append(detx)
            y_coords.append(dety)

    plt.figure(figsize=(8, 8))
    plt.scatter(x_coords, y_coords, s=200, c='red', marker='s', edgecolors='black')
    plt.xlim(0.5, 6.5)
    plt.ylim(0.5, 6.5)
    plt.xticks(np.arange(1, 7))
    plt.yticks(np.arange(1, 7))
    plt.grid(True)
    plt.title(f"Region: {os.path.basename(filepath)}", fontsize=9)
    plt.savefig(filepath.replace(".reg", ".png"))
    print(f"Saved plot as: {filepath.replace('.reg', '.png')}")

    if show:
        plt.show()
解説:
- リージョンファイルを開き、
+boxで始まる行から座標を抽出します。 - 座標情報を使い、
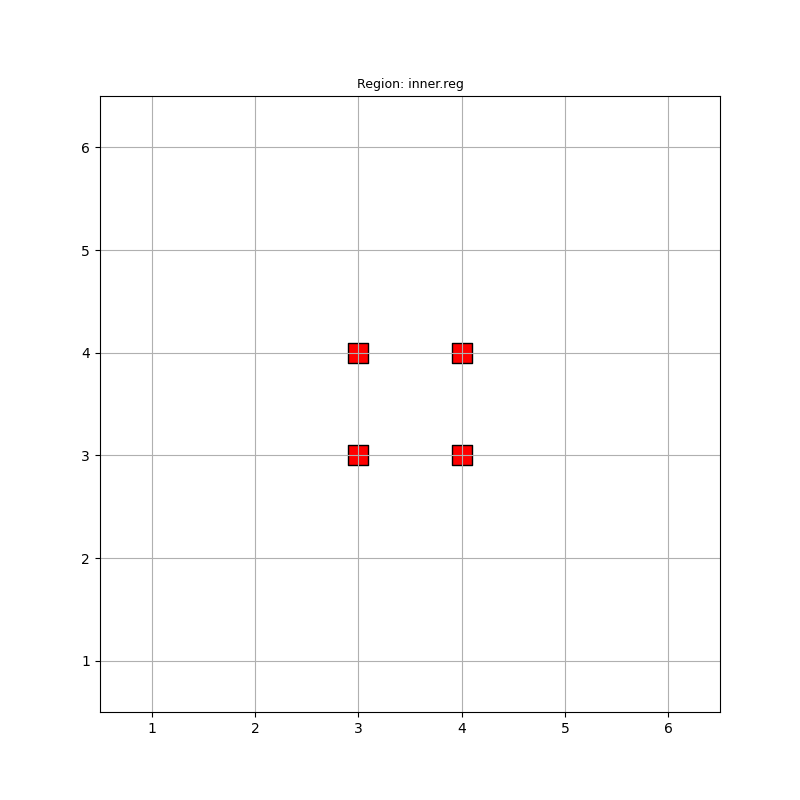
matplotlibでピクセルの位置をプロットします。四角いマーカーが使われ、プロットは6×6のグリッドで表示されます。
3. コマンドライン引数の処理
def main():
    parser = argparse.ArgumentParser(
        description="Generate DS9 region files and plot them using matplotlib.",
        epilog=(
            "Examples:\n"
            "  resolve_util_gen_regionfile.py 0,17,18,35 inner\n"
            "  resolve_util_gen_regionfile.py 1,2,3,...,35 outer\n"
            "Use --show to display the plot in a GUI window."
        ),
        formatter_class=argparse.RawTextHelpFormatter
    )
    parser.add_argument(
        "pixels", type=str, help="Comma-separated list of pixel numbers (e.g., '0,17,18,35')."
    )
    parser.add_argument(
        "name", type=str, help="Short name for the output files (e.g., 'inner')."
    )
    parser.add_argument(
        "--show", "-s", action="store_true", help="Display the plot in a GUI window."
    )

    args = parser.parse_args()
    region_file = generate_region_file(args.pixels, args.name)
    parse_and_plot_region_file(region_file, args.show)

if __name__ == "__main__":
    main()
解説:
-
argparseを使ってコマンドライン引数を処理します。-
pixels: カンマ区切りのピクセル番号 -
name: 出力ファイルの名前 -
--show: プロットを表示するオプション
-
- コマンドラインから入力された情報をもとにリージョンファイルを生成し、プロットします。
4. 実行例
- 内側の pixel の領域生成
$ python resolve_util_gen_regionfile.py 0,17,18,35 inner --show
Generated: inner.reg
Saved plot as: inner.png
$ cat inner.reg
physical
+box(3,3,1,1)
+box(3,4,1,1)
+box(4,3,1,1)
+box(4,4,1,1)
このコマンドは、ピクセル0、17、18、35を含むリージョンファイルinner.regを生成し、プロットを表示します。
- 外側の pixel の領域生成
$ python resolve_util_gen_regionfile.py 1,2,3,4,5,6,7,8,9,10,11,13,14,15,16,19,20,21,22,23,24,25,26,27,28,29,30,31,32,33,34 outer --show
Generated: outer.reg
Saved plot as: outer.png
5. まとめ
このスクリプトを使うことで、以下のことが学べます。
- XRISM/Resolve の DS9 region ファイルの構造
-
numpyとmatplotlibを使ったデータ処理と可視化 -
argparseを使ったコマンドライン引数処理

