python を用いた fits画像をWCS空間で上手に重ねる方法
環境構築
pythonにmatplotlibとastropyがインストールされていればOK。anconda3系が入っていればデフォルトでOK。
銀経銀緯で2つの画像を重なる例
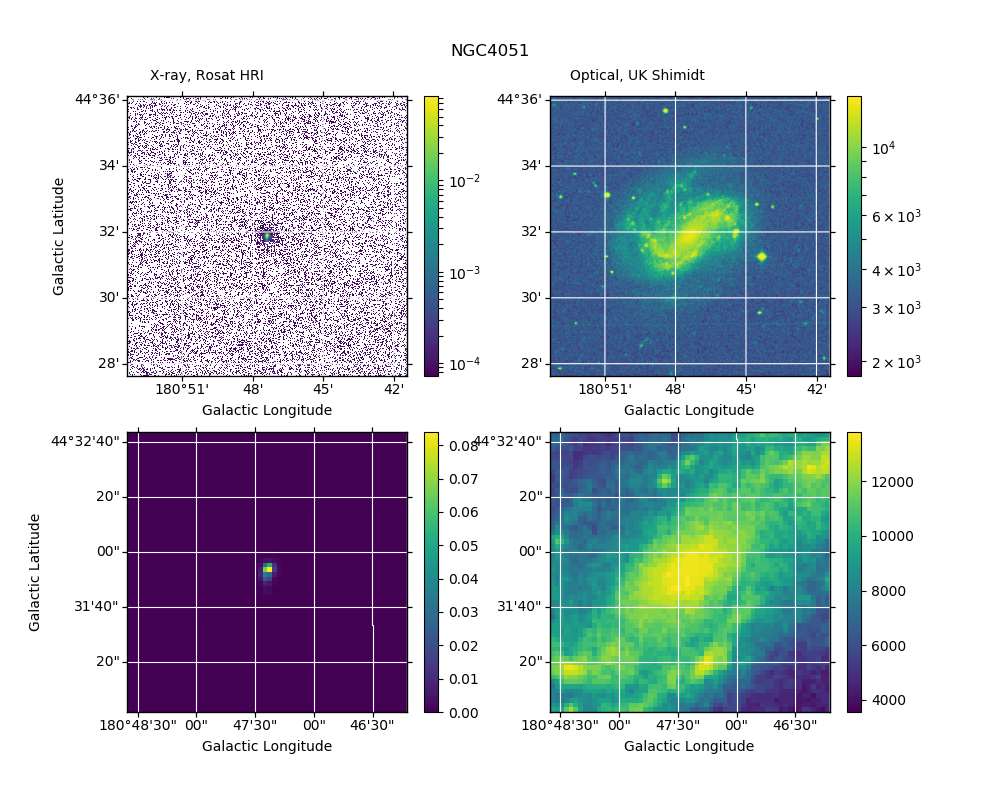
可視光とX線のNGC4051の画像を例として、それぞれ全体像のプロットと、中心付近を拡大したプロットの例を示します。
ポイント
-
画像のfitsファイルからWCSクラスを生成し、それをmatplotlibのprojectionというオプションに入れるだけ。ただし、これだけだと初期の画像サイズにしか表示されない。
-
ある場所を拡大したい場合は、画像ファイルと同じように、WCSオブジェクトにカットをかける。サンプルコードの、hriwcs[hricx-hridx:hricx+hridx,hricy-hridx:hricy+hridx] の箇所。これを matplotlib の wcs オプションに与えればよい。
-
2つの画像を重ねて表示したい場合は、難しい問題になる。その場合は、 WCS座標でイメージをマージしpythonでプロットする方法 に簡単にまとめてます。
コードとファイル置き場
- qiita_plot_fits_2image.py
- NGC4051の可視とX線イメージ
画像の取り方は、pythonのastroqueryを用いて検索し、skyviewでfits画像を取得する方法を参考にされたい。
サンプルコード
import matplotlib
matplotlib.use('TkAgg')
import glob
import matplotlib.pyplot as plt
import sys
from matplotlib.colors import LogNorm
from astropy.wcs import WCS
from astropy.io import fits

name="NGC4051"

hri = glob.glob(name + '*HRI*.fits')
dss = glob.glob(name + '*DSS*.fits')

if len(hri) == 1 and len(dss) == 1:
	pass
else:
	print("need to store HRI and DSS fits")

F = plt.figure(figsize=(10,8))

hrifilename = hri[0]
hriname = hrifilename.replace(".fits",".png")
hrihdu = fits.open(hrifilename)[0]
hriwcs = WCS(hrihdu.header)
hridata = hrihdu.data

hrixlen, hriylen = hridata.shape
hricx = int(0.5 * hrixlen)
hricy = int(0.5 * hriylen)
hridx = int(hrixlen*0.1)
hriwcscut = hriwcs[hricx-hridx:hricx+hridx,hricy-hridx:hricy+hridx]

dssfilename = dss[0]
dssname = dssfilename.replace(".fits",".png")
dsshdu = fits.open(dssfilename)[0]
dsswcs = WCS(dsshdu.header)
dssdata = dsshdu.data

dssxlen, dssylen = dssdata.shape
dsscx = int(0.5 * dssxlen)
dsscy = int(0.5 * dssylen)
dssdx = int(dssxlen*0.1)
dsswcscut = dsswcs[dsscx-dssdx:dsscx+dssdx,dsscy-dssdx:dsscy+dssdx]

plt.figtext(0.45,0.93, name, size="large")
plt.figtext(0.15,0.9, "X-ray, Rosat HRI")
plt.figtext(0.57,0.9, "Optical, UK Shimidt")

plt.subplot(221, projection=dsswcs)
#		plt.subplot(221, projection=hriwcs)
try:
	plt.imshow(hridata, origin='lower', norm=LogNorm())
	plt.colorbar()
except:
	print("ERROR, couldn't plot log-z scale")
	plt.close()

plt.grid(color='white', ls='solid')
plt.xlabel('Galactic Longitude')
plt.ylabel('Galactic Latitude')

plt.subplot(223, projection=dsswcscut)
#		plt.subplot(223, projection=hriwcscut)
plt.imshow(hridata[hricx-hridx:hricx+hridx,hricy-hridx:hricy+hridx], origin='lower')
plt.colorbar()
plt.grid(color='white', ls='solid')
plt.xlabel('Galactic Longitude')
plt.ylabel('Galactic Latitude')


plt.subplot(222, projection=dsswcs)
try:
	plt.imshow(dssdata, origin='lower', norm=LogNorm())
	plt.colorbar()
except:
	print("ERROR, couldn't plot log-z scale")
	plt.imshow(dssdata, origin='lower')
	plt.colorbar()

plt.grid(color='white', ls='solid')
plt.xlabel('Galactic Longitude')

plt.subplot(224, projection=dsswcscut)
plt.imshow(dssdata[dsscx-dssdx:dsscx+dssdx,dsscy-dssdx:dsscy+dssdx], origin='lower')
plt.colorbar()
plt.grid(color='white', ls='solid')
plt.xlabel('Galactic Longitude')

plt.savefig(name  + ".png")
plt.close()
出力結果
上2つの全体像は z 軸を log で表示し、下2つはリニアで表示している。z 軸を log 表示するときにデータが空やゼロしかないとこけるので、try except で回避するようにしている。
参考例
pythonのastroqueryを用いて検索し、skyviewでfits画像を取得する方法を用いて、X線(ROSAT)と可視光(DSS)の画像を取得して作成したgifアニメーションの例。gif アニメを作るには、convert -delay 100 -loop 1 *.png xrayopt.gif で生成した。
- X線と可視光 (~200天体) : http://www-x.phys.se.tmu.ac.jp/~syamada/qiita/qiita_wcs/xrayopt.gif
- 可視光 (~400天体): http://www-x.phys.se.tmu.ac.jp/~syamada/qiita/qiita_wcs/opt.gif