はじめに
この記事では、GDSIIファイルを gdstk だけで生成するのではなく、 Shapely の機能を使って簡単に設計する方法を紹介します。
gdstk の使い方については、
などで紹介したのでそちらを参考にしてください。
ここでは、gdstk を使うよりも、Shapely という GEOSをベースとしたpythonライブラリで、ジオメトリの操作および分析のために使われます。Shapely を使うと、簡単にジオメトリの重なりや、面積なども計算できるので、Shapelyを使ってジオメトリを生成し、それを gdstk を用いて GDSファイルに変換する方法を紹介します。
この記事は、google colab でも実行できるように、
を用意してあります。
可変長の配線幅を生成したいときは、
を参考にしてください。
前準備
gtdtk の install
詳細は、
を参考にしてください。
ここでは、google colab の例だけ紹介しておきます。
# install condacolab
!pip install -q condacolab
import condacolab
condacolab.install() # Mambaforge-23.1.0-1-Linux-x86_64.sh...  @2023.11.30
# check conda version
!conda --version # conda 23.1.0
# Create a new conda environment named gdstk
!conda create -n gdstk -c conda-forge --strict-channel-priority
# Activate the new environment
!conda activate gdstk
# Install gdstk
!conda install gdstk
必要なモジュールの import
import matplotlib.pyplot as plt
import numpy as np
from IPython.display import *
import gdstk
import shapely.geometry as geometry

print("gdstk.__version__ = ", gdstk.__version__)
gdstk._version_ = 0.9.47 (2023.11.29) を用いた例になります。
GDS ファイルを matplotlib で表示する関数
これも詳細は別の記事 を参考にしてください。ここでは、 gdsファイルを matplotlib で表示する関数の定義だけ紹介しておきます。
def plot_gds_onlypoly(gdsfile, transformation=None, maxlayer = 10, margin=3, debug=False):
  lib = gdstk.read_gds(gdsfile)
  top_cells = lib.top_level()
  fig, ax = plt.subplots(1, 1, figsize=(8,8), tight_layout=True)
  cmap = plt.get_cmap('viridis', maxlayer)
  # すべてのトップレベルセルのポリゴンをプロット
  for cell in top_cells:
    (xmin,ymin),(xmax,ymax) = cell.bounding_box()
    if hasattr(cell, 'polygons'):
      print("polygons in cell is found. length = ", len(cell.get_polygons()))
      for polygon in cell.get_polygons(): # cell.polygons does not work when the reference is used.
        points = np.array(polygon.points)
        if debug: print("     layer = ", polygon.layer, " area = ", polygon.area())
        ax.plot(*np.vstack((points, points[0])).T, linestyle='solid', linewidth = 1, alpha=0.8, color=cmap(polygon.layer))

  ax.set_title("polygons")
  ax.set_xlim(xmin - margin, xmax + margin)
  ax.set_xlim(xmin - margin, xmax + margin)
  ax.set_aspect('equal', adjustable='box')
  ax.grid(alpha=0.3)
  plt.savefig(gdsfile.replace(".gds",".png"))
  plt.show()
Shapely を用いて多画素のジオメトリを生成する関数
まず、関数 create_multi_pixel_array を作成します。多数のピクセルを含む配列の幾何学的レイアウトを生成し、それを可視化するために設計されています。関数は shapely ライブラリを使用して幾何学的オブジェクトを生成し、matplotlib を使用して結果を描画します。以下は各部分の詳細です。
関数の定義
- num_rows, num_cols: 配列の行数と列数。
- pad_size, pixel_size: パッドとピクセルのサイズ。
- wire_width, wire_length: ワイヤの幅と長さ。
- spacing: ピクセル間のスペース。
リストの初期化:
pads, pixels, wires というリストを初期化して、パッド、ピクセル、ワイヤの幾何学的形状を格納します。
    # Initialize lists for pads, pixels, and wires
    pads, pixels, wires = [], [], []
全体的なレイアウトサイズの計算:
配列の全幅と全高を計算します。
    # Calculate total layout size
    total_width = num_cols * (pixel_size + spacing)
    total_height = num_rows * (pixel_size + spacing)
各ピクセルの幾何学的形状の生成:
二重ループを使用して各ピクセルの位置を計算し、shapely.geometry.box と shapely.geometry.LineString を使用してピクセル、パッド、ワイヤの形状を生成します。
    # Create geometry for each pixel in the array
    for i in range(num_rows):
        for j in range(num_cols):
            # Calculate positions
            x_position = (j - num_cols / 2) * (spacing) + spacing / 2
            y_position = (i - num_rows / 2) * (spacing) + spacing / 2
...
美しい書き方ではないかもしれませんが、、この for loop の中でジオメトリを生成します。
            wire_left = wire_left.buffer(wire_width, cap_style="flat")
            wire_right = wire_right.buffer(wire_width, cap_style="flat")
この操作により、LineString という幅のないオブジェクトから、幅のある Polygon に変換します。配線は一次元の紐で生成してから、幅をもたせる、という作戦です。cap_style はデフォルトで round で丸みを持った形状になりますので、ここでは flat にして、特に余計なことはしない、という設定にしてあります。
matplotlibを使用した描画:
plt.subplots で描画エリアを作成し、ax.fill と ax.plot を使用してパッド、ピクセル、ワイヤを描画します。
    # Plotting with matplotlib
    fig, ax = plt.subplots()
    for pad in pads:
        x, y = pad.exterior.xy
        ax.fill(x, y, alpha=0.5, ec='none')
    for pixel in pixels:
        x, y = pixel.exterior.xy
        ax.fill(x, y, alpha=0.5, ec='none', fc='blue')
    for wire in wires:
        x, y = wire.exterior.xy
        ax.plot(x, y, linewidth=wire_width, color='black')
pads と pixels は fill で中身を塗りつぶして、wires という配線を想定したオブジェクトは plot で線で描画しています。
戻り値
関数は、生成されたパッド、ピクセル、ワイヤのリストを返します。
この関数は、電子工学やマイクロエレクトロニクスの分野で、微細な電子回路やセンサーアレイの設計の簡易版をイメージして作成しています。
下記、def create_multi_pixel_array の全文になります。
def create_multi_pixel_array(num_rows, num_cols, pad_size, pixel_size, wire_width, wire_length, spacing):
    """
    Create a geometry layout for a multi-pixel array setup with shapely and plot it with matplotlib.
    """

    # Initialize lists for pads, pixels, and wires
    pads, pixels, wires = [], [], []

    # Calculate total layout size
    total_width = num_cols * (pixel_size + spacing)
    total_height = num_rows * (pixel_size + spacing)

    # Create geometry for each pixel in the array
    for i in range(num_rows):
        for j in range(num_cols):
            # Calculate positions
            x_position = (j - num_cols / 2) * (spacing) + spacing / 2
            y_position = (i - num_rows / 2) * (spacing) + spacing / 2

            # Create pixel
            pixel = geometry.box(x_position - pixel_size / 2, y_position - pixel_size / 2,
                                 x_position + pixel_size / 2, y_position + pixel_size / 2)
            pixels.append(pixel)

            # Create pads for each pixel
            pad_left = geometry.box(x_position - pad_size / 2, y_position - pad_size/2 - pixel_size/2 - wire_length/2,
                                    x_position + pad_size / 2, y_position + pad_size/2 - pixel_size/2 - wire_length/2)
            pad_right = geometry.box(x_position - pad_size / 2, y_position - pad_size/2 + pixel_size/2 + wire_length/2,
                                     x_position + pad_size / 2, y_position + pad_size/2 + pixel_size/2 + wire_length/2)
            pads.extend([pad_left, pad_right])

            # Create wires for each pixel
            wire_left = geometry.LineString([(x_position, y_position - pixel_size / 2), (x_position, y_position - pixel_size / 2 - wire_length/2)])
            wire_right = geometry.LineString([(x_position, y_position + pixel_size / 2), (x_position, y_position + pixel_size / 2 + wire_length/2)])
            wire_left = wire_left.buffer(wire_width, cap_style="flat")
            wire_right = wire_right.buffer(wire_width, cap_style="flat")

            wires.extend([wire_left, wire_right])

    # Plotting with matplotlib
    fig, ax = plt.subplots()
    for pad in pads:
        x, y = pad.exterior.xy
        ax.fill(x, y, alpha=0.5, ec='none')
    for pixel in pixels:
        x, y = pixel.exterior.xy
        ax.fill(x, y, alpha=0.5, ec='none', fc='blue')
    for wire in wires:
        x, y = wire.exterior.xy
        ax.plot(x, y, linewidth=wire_width, color='black')

    ax.set_aspect('equal', adjustable='box')
    plt.savefig("geom_"+str(num_rows) + "_" + str(num_cols) + ".png")
    plt.show()

    return pads, pixels, wires
実行例
いよいよ準備が整ったので実行してみましょう。
1x2 画素の例
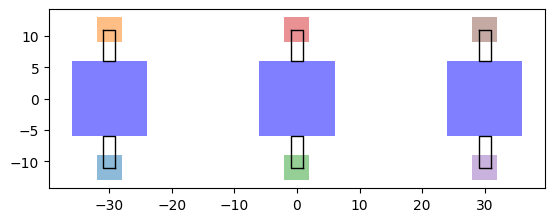
now_rows と num_cols を 1, 3 に設定し、下記のパラメータで画素を生成してみます。
# Example parameters
num_rows = 1    # Number of rows in the pixel array
num_cols = 3    # Number of columns in the pixel array
pad_size = 4   # Size of the bonding pads
pixel_size = 12.0 # Size of each pixel
wire_width = 1 # Width of the wires
wire_length = 10  # Length of the wires
spacing = 30.0    # Spacing between pixels

# Create and plot the geometry
pads, pixels, wires = create_multi_pixel_array(num_rows, num_cols, pad_size, pixel_size, wire_width, wire_length, spacing)
これを実行すると、次のような3つの画素が生成されます。
10 x 5 画素の例
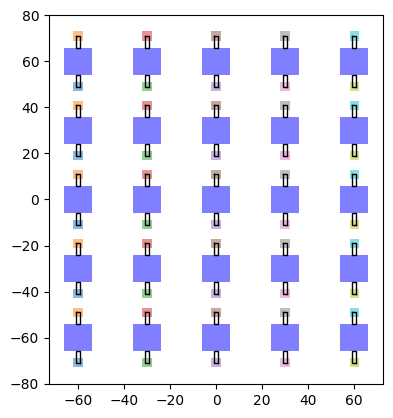
次に、now_rows と num_cols を 5, 5 に設定し、25画素の例を作成してみます。
# Example parameters
num_rows = 5    # Number of rows in the pixel array
num_cols = 5    # Number of columns in the pixel array
pad_size = 4   # Size of the bonding pads
pixel_size = 12.0 # Size of each pixel
wire_width = 1 # Width of the wires
wire_length = 10  # Length of the wires
spacing = 30.0    # Spacing between pixels

# Create and plot the geometry
pads, pixels, wires = create_multi_pixel_array(num_rows, num_cols, pad_size, pixel_size, wire_width, wire_length, spacing)
これを実行すると、5x5画素のジオメトリが生成されます。
gdstk で GDSII 形式に書き出して保存し、matplotlib で確認
このようにして、Shapelyでジオメトリを作成して、問題なければ、gdstk を用いて GDSII形式に書き出してみましょう。
ここも詳細は別の記事 を参考にしてください。
# LSI回路のジオメトリを作成
lib = gdstk.Library()
cell = lib.new_cell("IMAGER_ARRAY")

tag = {
    "pixel": {"layer": 1, "datatype": 1},
    "wire": {"layer": 5, "datatype": 5},
    "pad": {"layer": 10, "datatype": 10},
}

# Convert shapely geometries to gdstk polygons
for pad in pads:
    cell.add(gdstk.Polygon(pad.exterior.coords, **tag["pad"]))
for pixel in pixels:
    cell.add(gdstk.Polygon(pixel.exterior.coords, **tag["pixel"]))
for wire in wires:
    cell.add(gdstk.Polygon(wire.exterior.coords, **tag["wire"]))

# Save the GDS file
outgdsfile="image_array.gds"
lib.write_gds(outgdsfile)

# GDSファイルに保存
lib.write_gds(outgdsfile)
plot_gds_onlypoly(outgdsfile, debug=False)
これを実行すると、
このように、 gdsファイルから次のようなジオメトリが生成されます。
gdsファイルを KLayout で見ると、
のように見えます。
最後に
gdstk を生で動かしてジオメトリを描くよりも、Shapely を使った方が便利かなぁと思って、この記事を書いてみました。


